

.avif)
TL;DR
- Sales productivity analytics helps revenue teams connect rep activity to pipeline movement and quota attainment. It measures revenue impact instead of tracking effort alone.
- The right KPIs, like lead response time and win rate, link daily activity directly to revenue.
- Real-time dashboards and integrated systems give RevOps and Finance teams a single source of truth. Sales Compensation teams share that same view.
- Productivity analytics works best when it connects seller behavior with revenue outcomes. Incentive compensation completes the picture.
- AI and predictive analytics are moving sales teams from reporting on the past to anticipating future performance.
Everstage POV: Sales productivity analytics works best when it links seller behavior to revenue outcomes. Adding incentive compensation makes that connection complete. Lacking it, teams track activity but miss what motivates performance.
Sales leaders and RevOps teams face one shared challenge. They see activity in the CRM but struggle to tie it to pipeline movement and quota progress. Incentive outcomes stay disconnected too.
That gap creates downstream problems for Sales Ops and Finance teams. Plan effectiveness stays unclear, and reps get limited earnings visibility. Insight into whether sales behavior improves revenue arrives late.
Salesforce's State of Sales Report found that sales professionals spend 25% of their time actively selling. Administrative work and internal meetings consume the rest.
When activity and compensation data live in separate systems, visibility breaks down. RevOps loses sight of which behaviors drive pipeline. Finance forecasts commission expense poorly, and Sales Compensation teams stay unsure whether incentive plans work. For organizations managing 1,000 or more commissionable payees, that disconnect compounds with every payout cycle.
Sales productivity analytics closes this gap between effort and outcome. It moves past surface-level activity tracking to show how time and effort translate into measurable results.
This guide defines sales productivity analytics and explains why it matters. It shows how the right metrics and dashboards help teams focus on growth.
You will gain practical steps to shift your sales process from activity-driven to outcome-driven. Every effort then moves your team toward its revenue goals.
What Is Sales Productivity Analytics and Why Does It Matter?
Sales productivity analytics uses data and dashboards to measure how sales activities generate pipeline and closed revenue. Those activities include calls and product demos. It helps teams move past counting actions to analyzing their impact on business outcomes.
Defines sales productivity analytics and how it differs from general sales analytics.
Sales productivity analytics sits within modern sales analytics. It uses metrics and predictive models to track performance and spot bottlenecks. The same models reveal how reps spend time and which activities drive results.
Managers who track patterns in rep behavior can spot inefficiencies. Examples include time lost to administrative work and slow lead responses. Teams can then fix bottlenecks before they hit targets or revenue forecasts.
Analytics also aligns sales and revenue teams. For organizations with thousands of commissionable payees, value appears when productivity data connects to incentive outcomes. Leaders need more than a list of active reps. They need to see which behaviors drive qualified pipeline and quota attainment.
Sales teams need analytics tools to turn these insights into impact. The best tools capture every activity and visualize performance in real time.
Sales Productivity vs. Sales Efficiency: What's the Difference?
Sales productivity measures revenue output relative to sales effort. Sales efficiency measures revenue relative to cost or resources. Both matter, and they answer different questions.
Compares sales productivity and sales efficiency across definition, metrics, and use cases.
Types of Sales Analytics Used to Improve Productivity
Four analytics types improve sales productivity, each answering a different question.
- Descriptive analytics: Explains what happened, like call volumes and win rates. It clarifies current pipeline health.
- Diagnostic analytics: Explains why performance changed, such as a drop in a rep's conversion rate. It guides rep coaching.
- Predictive analytics: Forecasts likely outcomes, like which deals are at risk or which reps may miss quota. It supports lead prioritization.
- Prescriptive analytics: Recommends the next best action, such as reassigning a stalled lead or adjusting an incentive. It optimizes workload.
What Modern Sales Productivity Analytics Tools Should Include
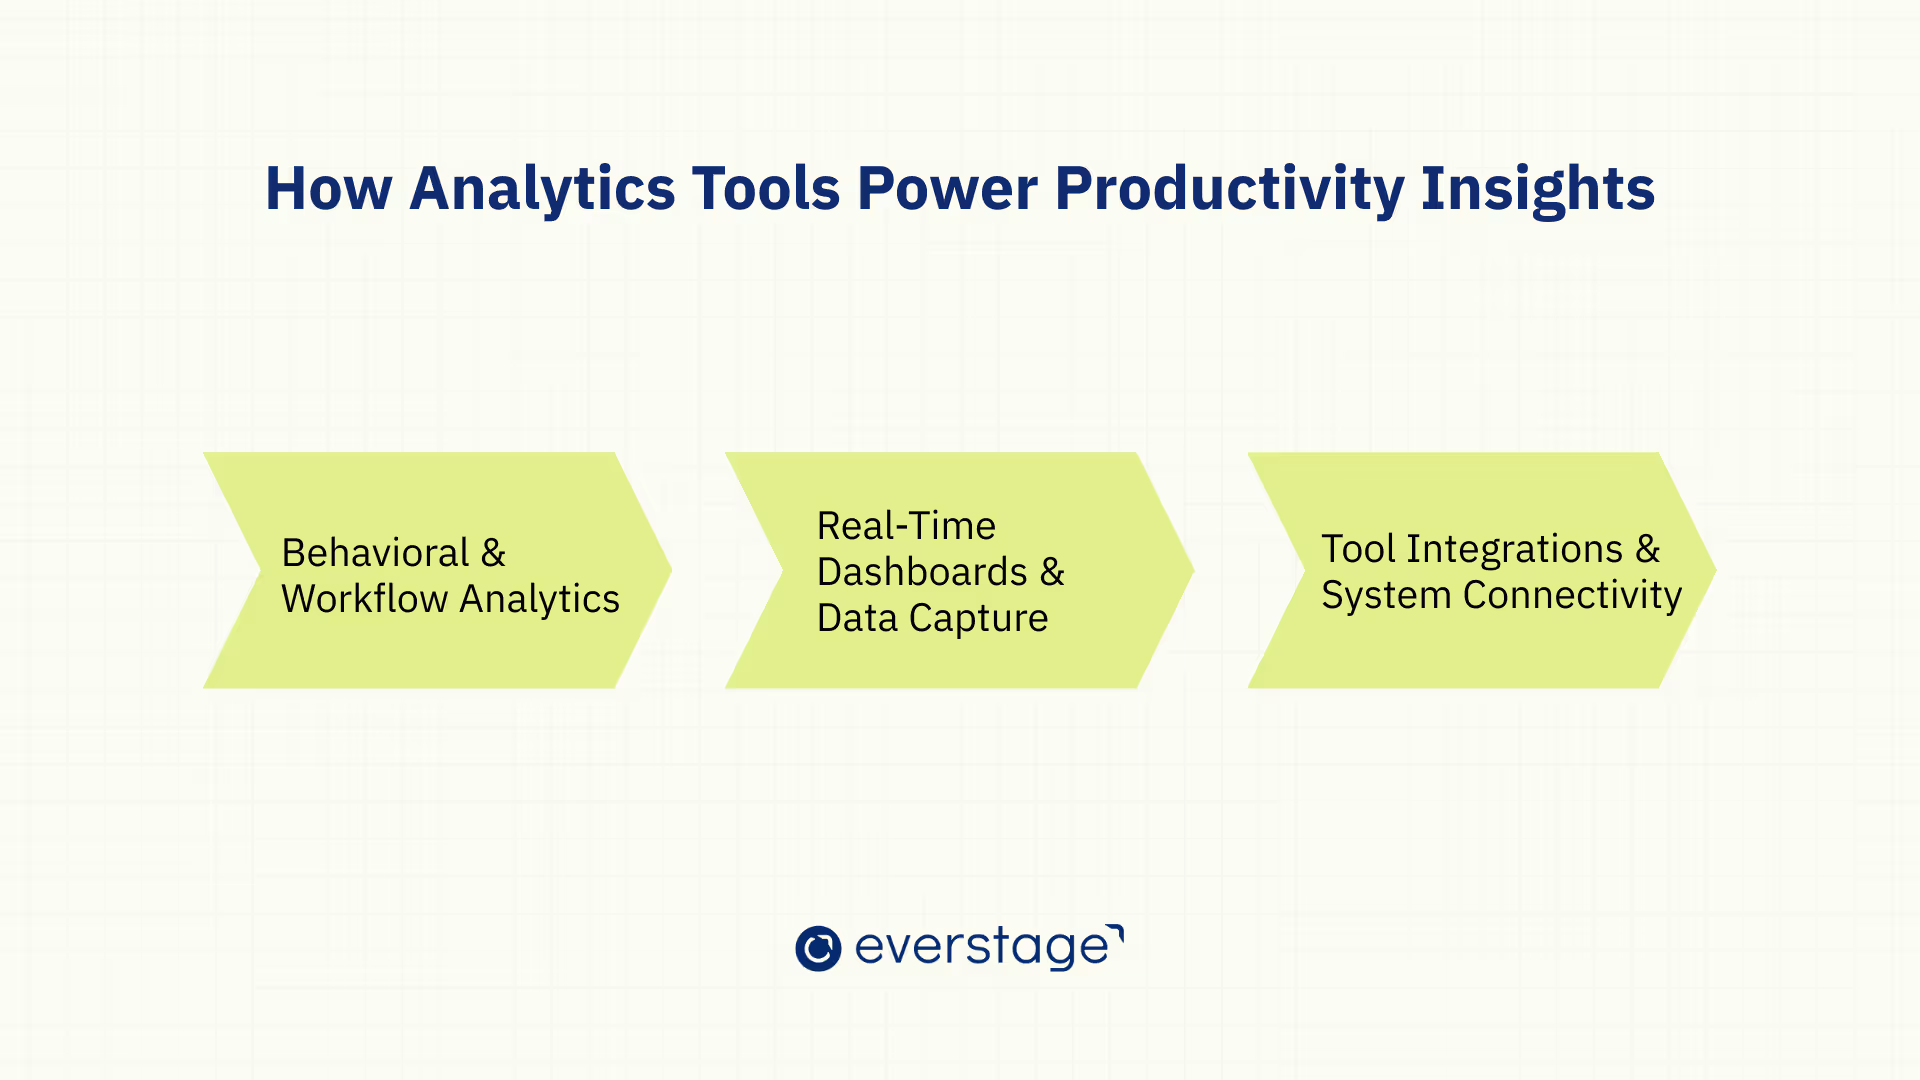
Modern sales productivity analytics tools should turn scattered activity data into clear, usable insights. AI-powered platforms have changed how sales organizations measure and improve productivity. Instead of relying on scattered CRM reports or guesswork, analytics consolidates every data point into clear insights.
These tools reveal how reps work and where time gets lost. The goal reaches past activity tracking to show what drives sales success.
1. Behavioral & Workflow Analytics
Behavioral and workflow analytics show how reps spend their time and where efficiency improves. Tracking daily actions surfaces patterns that stayed hidden before. These tools analyze factors such as:
- Time distribution: How much time is spent in internal meetings versus customer-facing conversations?
- Engagement patterns: Frequency and timing of calls and demos across the sales cycle.
- Work habits: How top-performing reps structure their day compared to underperformers.
These insights help managers identify what drives results. Suppose analytics shows top reps spend more time on client engagement and less on admin. Leaders can then redesign workflows to copy those behaviors across the team.
Workflow analytics also flag inefficiencies, like excessive meeting time or delayed follow-ups. Teams can then streamline processes and focus on revenue-generating work.
In platforms like Everstage, performance insights reach past traditional incentive tracking. Combining activity and performance data, the platform shows reps how their actions connect to outcomes and earnings. The focus shifts from activity to impact, so reps stay effective instead of merely busy.
2. Real-Time Dashboards & Data Capture
Real-time dashboards turn raw data into live visibility for sales leaders. Managers spot performance gaps across teams without waiting for periodic reports. They track call volumes and meeting completion rates as they happen. Effective productivity dashboards display:
- Response times: How quickly reps follow up on new leads.
- Pipeline velocity: How fast deals move from one stage to another.
- Conversion rates: The percentage of interactions turning into opportunities or closed deals.
- Goal tracking: Real-time progress against quotas and team targets.
A dashboard showing time-to-first-response per rep flags where leads get neglected. Managers can step in early and reassign leads before deals slip.
Real-time data encourages proactive management. Teams course-correct daily instead of reacting weeks later, which speeds sales cycles and lifts win rates.
With Everstage, performance dashboards connect quota progress and attainment in one place. They also surface incentive eligibility and commission visibility. That makes performance data more actionable for reps and managers.
3. Tool Integrations & System Connectivity
Tool integrations give sales productivity analytics its real power. Analytics tools work better when connected across the tech stack through Everstage integrations. Those connections reach CRM systems and dialers. They extend to email clients and meeting software.
Integrated systems also support better lead generation tracking and a unified view of customer relationships across platforms.
Siloed data blocks a full view. Managers see call logs in one system and email engagement in another, with pipeline data elsewhere. Forming a complete productivity picture becomes hard. Connected systems let analytics tools:
- Create a single source of truth by syncing activities and results across platforms.
- Reduce manual data entry and reporting time for reps.
- Enable end-to-end visibility of the sales process, from first contact to closed deal.
Integrated systems also drive stronger collaboration between sales operations and leadership teams. Everyone works from the same accurate, real-time data.
With Everstage, dashboards connect productivity and performance data with compensation insights. Reps see how their actions affect earnings, and leaders see whether incentive plans reinforce the right behaviors.
Sales Productivity Analytics Metrics and KPIs to Track
The right metrics form the foundation of sales productivity analytics. Data gains meaning when tied to indicators that show whether activities drive growth. These KPIs give a complete picture of sales effectiveness and efficiency.
Lists core productivity KPIs with formulas, type, insight, and review cadence.
Leading Indicators: Activity-Based Sales Productivity Metrics
Leading indicators track behaviors that shape future performance. These metrics help managers forecast results early and find where adjustments improve pipeline health. Key metrics include:
- Calls made per day or week: Tracks activity levels and consistency across the team.
- Call-to-meeting conversion rate: Measures how effectively reps turn outreach into qualified engagements.
- Lead response time: Captures how quickly reps follow up with new prospects, a strong predictor of conversion success.
- Average number of touches per opportunity: Reflects persistence and engagement quality across the buying process.
These metrics matter because high-quality activity drives pipeline creation. Monitoring them keeps reps focused on the actions that build pipeline.
Reducing lead response time correlates with higher win rates, since prospects engage more when contacted within minutes. Leading indicators let sales leaders spot warning signs early, like declining engagement or slower follow-ups, before they hit revenue forecasts.
Lagging Indicators: Pipeline and Revenue Outcome Metrics
Lagging indicators validate sales efforts by measuring results after the activity happens. They show whether your team's strategy works. Core metrics include:
- Pipeline velocity: The speed at which deals move from initial contact to close.
- Win rate: The percentage of opportunities successfully converted into customers.
- Average deal size: The typical total revenue value of each closed deal.
- Sales cycle length: The average time it takes for a lead to progress through the pipeline.
These KPIs show whether reps convert activity into results. A fast-moving pipeline and strong win rate signal healthy deal momentum and targeted selling.
When sales cycles lengthen or deal sizes shrink, sales strategy and buyer needs have drifted apart. Analyzing these outcome metrics helps teams refine their approach and focus on higher-value opportunities. Forecasting accuracy improves too.
Rep-Level Productivity, Capacity, and Workload Metrics
Team-wide metrics matter, and individual rep productivity adds deeper insight into workload balance. Overworked reps see diminishing returns, while underused reps add too little to pipeline growth. Key metrics include:
- Time spent selling vs. administrative tasks: Reveals how much time reps dedicate to revenue-generating activities versus manual work.
- Customer-facing vs. internal meeting time: Measures how effectively reps balance client engagement with internal collaboration.
- Rep workload capacity: Assesses whether individuals are operating at an optimal pace or stretched too thin.
- Burnout signals: Identifies patterns like frequent overtime or excessive time on low-value tasks.
These metrics matter because sustainable productivity is the goal. Real efficiency means doing the right things consistently while avoiding burnout. Tracked over time, these indicators help leaders reallocate tasks and automate routine work. Reps' well-being stays protected as performance holds.
For platforms like Everstage, the link between analytics and incentives matters most. Tying productivity metrics to compensation structures, Everstage rewards reps for efficient, value-driven work over raw activity volume.
Incentive and Compensation Metrics
Commissionable teams gain more from productivity metrics paired with incentive and compensation data. Leaders should track whether compensation plans encourage the activities that drive revenue. Teams with 100 or more payees benefit most from linking productivity metrics to quota and earnings visibility.
- Quota attainment: Shows whether productivity improvements translate into goal achievement.
- Incentive eligibility: Helps reps understand which actions move them closer to payouts.
- Commission visibility: Reduces uncertainty and keeps reps focused on high-value activities.
- Plan effectiveness: Reveals whether incentive structures are reinforcing desired sales behaviors.
Connecting these metrics to productivity data is core to Everstage's incentive management and sales compensation capabilities.
How Incentives Shape Sales Productivity
Activity tracking shows what reps are doing. Incentive analytics shows whether those actions are being reinforced by the compensation plan.
Commissionable teams grow more productive when reps see how quota progress and deal outcomes affect earnings. This visibility helps reps prioritize higher-impact work. It also helps leaders confirm whether incentive plans drive the right behaviors.
When activity data and compensation data sit in separate systems, a rep stays busy but unproductive. A leader rewards the wrong behaviors unknowingly. Connecting the two closes that gap.
- Quota attainment: Confirms that busier weeks actually produce goal achievement.
- Incentive eligibility: Guides reps toward the deals that trigger payouts.
- Commission visibility: Removes guesswork so reps chase high-value work.
- Plan effectiveness: Shows leaders whether the plan rewards revenue-driving behavior.
Everstage's incentives and sales compensation products surface this exact connection.
How to Improve Sales Productivity with Analytics
Sales productivity analytics gains power when it moves from insight to action. The aim reaches past tracking metrics to using data that removes friction and improves workflows.
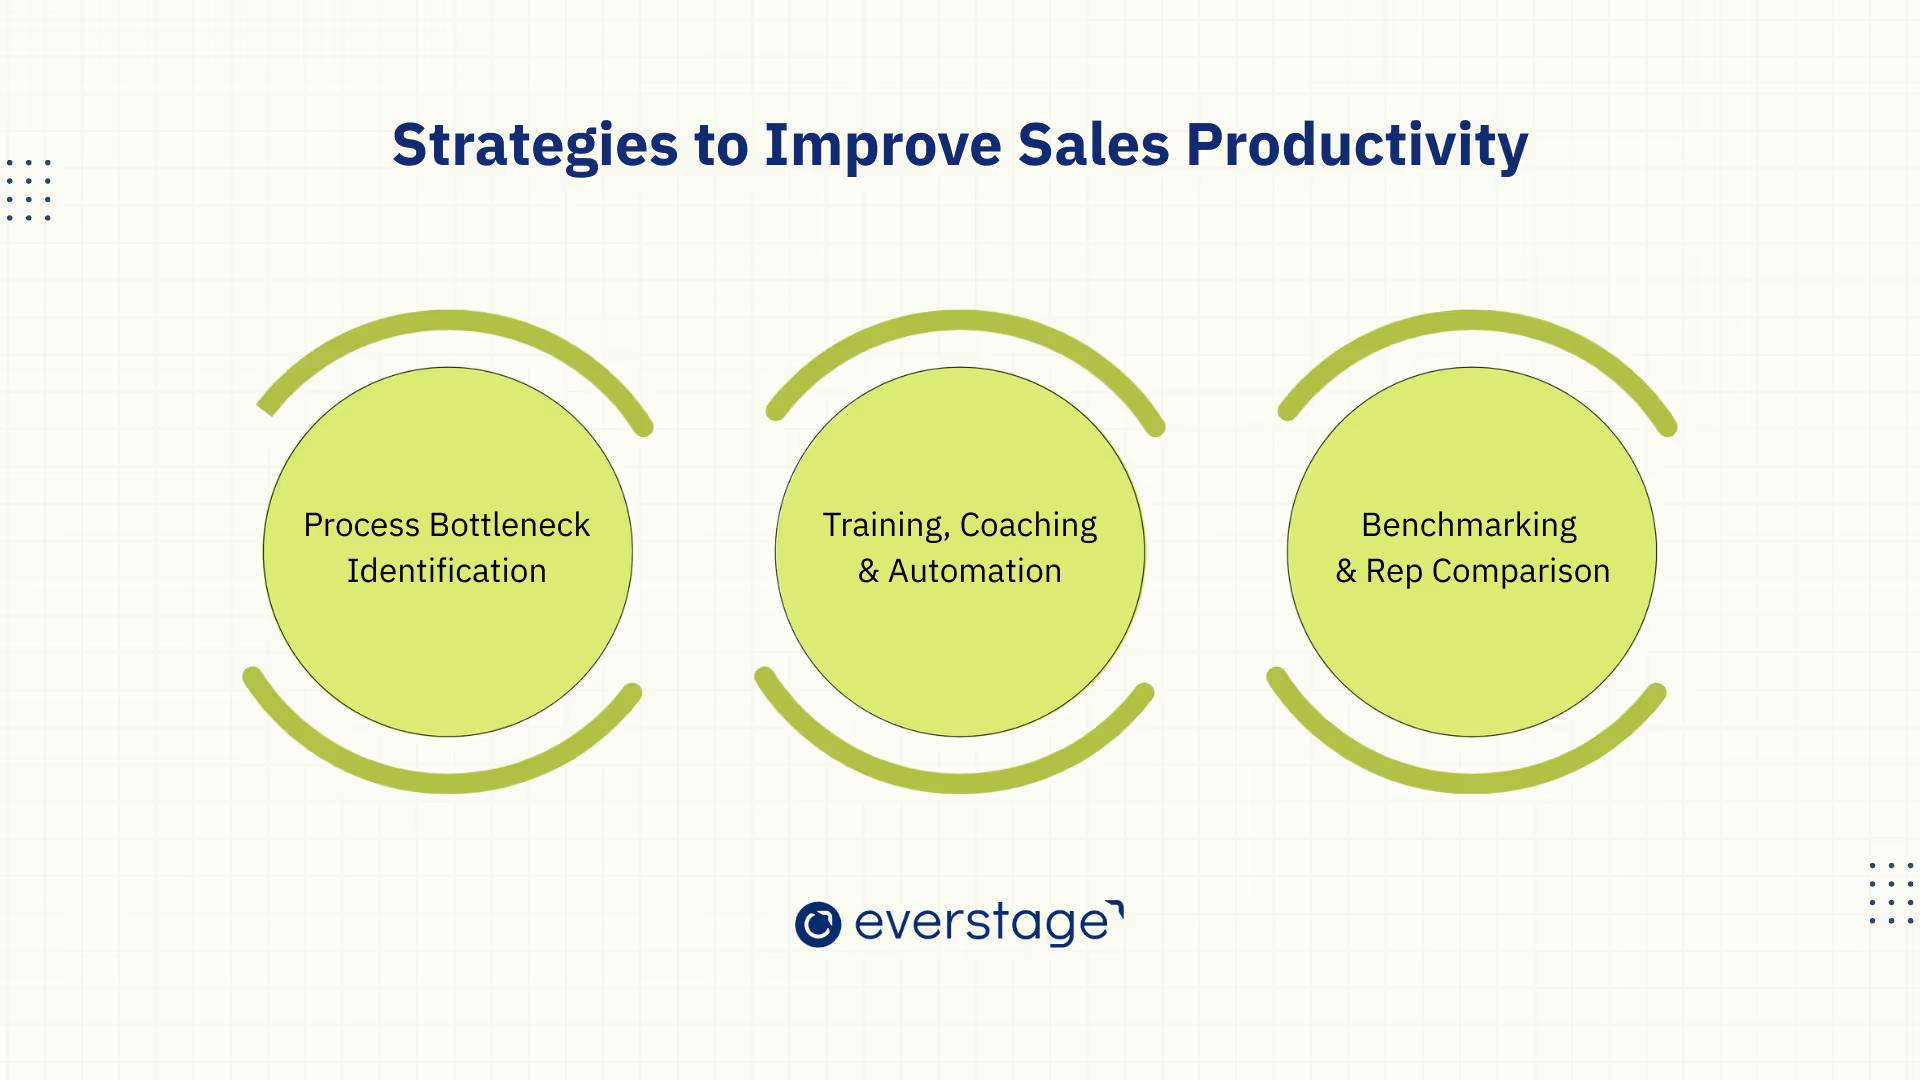
Applied well, analytics helps sales leaders clear bottlenecks and strengthen coaching. It also automates repetitive tasks and benchmarks performance, which lifts efficiency and revenue.
Identify Sales Process Bottlenecks with Analytics
Once leaders know which activities influence pipeline and quota progress, analytics shows where deals stall. It also points to coaching or incentive changes that improve rep behavior. Examining each funnel stage makes inefficiency patterns easier to spot. For instance:
- Slow lead follow-up signals workflow inefficiency or unclear ownership of new leads. Analytics highlights these delays so managers can reassign or automate routing.
- Deals stuck in one stage too long may indicate poor qualification or no decision-maker access.
- Low conversion rates during demos or calls can point to skill gaps in discovery or presentation techniques.
Dashboards make these bottlenecks visible in real time. Managers can rebalance workloads or offer targeted support. Monitoring these metrics continuously lets teams redesign weak steps and speed deal progression, which drives revenue growth.
Use Analytics for Sales Coaching, Training, and Automation
Analytics measures performance and helps improve it. Used well, it anchors personalized training and smarter automation.
- Training: Analytics pinpoints where skills need reinforcement. If a rep makes many calls but converts few, data reveals the gap. Leaders can then build training on objection handling or qualification.
- Coaching: Managers guide performance conversations with data instead of instinct. Showing reps examples from their own activity metrics makes feedback credible and actionable.
- Automation: Analytics integrates with CRM and communication tools to streamline routine tasks. Teams can automate updates and alerts, like a notification when lead response time exceeds five minutes.
Automation tools can also surface upsell or cross-sell opportunities from prior customer interactions. That saves selling time and keeps every rep focused on high-value, deal-closing work.
Benchmarking & Rep Comparison
Transparent benchmarks motivate reps to hit sales goals and improve customer retention. Benchmarking turns analytics into a continuous improvement engine. Comparing top reps to team averages reveals behaviors that drive success, which organizations can apply across the team.
Analytics allows leaders to:
- Identify high-impact behaviors: Determine which actions, such as quick follow-ups or structured outreach sequences, correlate with higher win rates.
- Establish best practices: Use data to replicate the methods of high performers across the team.
- Encourage fair competition: Create transparent benchmarks that motivate reps to reach achievable, data-backed goals.
These insights also strengthen incentive planning. Organizations can reward productive behaviors that sustain long-term performance, going beyond end results alone. For example:
- A team using automated lead alerts could reduce response times by 50%, leading to measurable gains in conversions.
- A weekly dashboard tracking calls and conversion rates keeps everyone aligned and accountable.
Platforms like Everstage strengthen this connection by linking productivity analytics to compensation data. Every rep then sees how performance drives both revenue and rewards.
Common Challenges in Sales Productivity Analytics
Naming the barriers helps teams roll out analytics that gets used. The common blockers and their fixes appear below.
Caption: Maps common analytics challenges to their business impact and fixes.
How to Choose Sales Productivity Analytics Tools
Use this vendor-neutral checklist when evaluating sales productivity analytics platforms:
- CRM integration: Native, two-way sync with your system of record.
- Real-time dashboards: Live visibility into pipeline and quota progress.
- Customizable KPI tracking: Ability to define metrics that match your sales motion.
- Forecasting capabilities: Predictive views of pipeline and attainment.
- Data quality controls: Validation and governance to keep insights reliable.
- Rep-level visibility: Individual performance, capacity, and workload views.
- Coaching workflows: Tools that turn data into actionable feedback.
- Automation triggers: Alerts and workflows based on data changes.
- Compensation connectivity: Links productivity to quota, incentives, and earnings.
- Security and ease of adoption: Enterprise-grade controls reps will actually use.
How AI Improves Sales Productivity Analytics
AI shifts sales productivity analytics from describing the past to shaping the future. Key use cases include:
- Interaction scoring: Ranks calls and emails by quality and intent signals.
- Next-best-action recommendations: Tells reps which deal to push and when.
- Forecasting risk detection: Flags deals likely to slip before they do.
- Rep coaching insights: Surfaces specific behaviors to reinforce or correct.
- Opportunity prioritization: Focuses reps on the highest-probability deals.
- Automated activity capture: Removes manual logging and improves data quality.
- Productivity anomaly alerts: Detects sudden drops in engagement or output.
One caution: AI is only as good as its data. Clean, contextual data, including compensation context, makes these models reliable.
Sales Productivity Analytics Implementation Roadmap
Move from concept to practice with a phased rollout:
- Define productivity goals: Agree on what success looks like before choosing metrics.
- Audit current data sources: Spot CRM and dialer data gaps, plus missing compensation data.
- Choose KPI tiers: Select leading and lagging metrics, then add incentive metrics.
- Integrate systems: Connect tools into a single source of truth.
- Build dashboards: Surface insights where reps and managers work.
- Establish review cadence: Review KPIs monthly and recalibrate quarterly.
- Train managers: Equip leaders to coach with data instead of instinct.
- Refine continuously: Adjust metrics as the business changes.
Future of Sales Productivity Analytics
Sales productivity analytics brings visibility and accountability into one framework. It shows leaders which rep activities create qualified pipeline and which deals slow down. It also flags where compensation plans reinforce the right behaviors, or the wrong ones.
The goal is tracking the right metrics over more metrics. A focus on KPIs like lead response time and win rate connects activity directly to revenue. These insights help managers decide faster and coach with evidence. Unproductive habits fade.
The future of sales productivity analytics leans predictive. With AI and machine learning, sales leaders move from reporting on past performance to anticipating results. They spot productivity risks early and model outcomes before problems arise.
To build a high-performing sales organization, push productivity analytics past activity tracking. Connect rep behavior and quota progress with compensation visibility and revenue outcomes in one operating rhythm.
Everstage helps revenue teams connect sales performance with incentive compensation and productivity insights. Reps learn what to prioritize, and leaders design incentives that reinforce the right behaviors.
Book a Demo to see how Everstage connects sales performance with incentive compensation and productivity insights. Your teams can then focus on the actions that drive revenue.
Questions worth asking
The things most people want to know before they commit.
How do you calculate sales productivity?
Sales productivity uses ratios that compare output to effort. Revenue per rep equals total revenue divided by number of reps. Revenue per selling hour equals revenue divided by hours spent selling. A rep generating $400,000 across 800 selling hours produces $500 per selling hour, which benchmarks against the team average.
What is the difference between sales productivity and sales efficiency?
Sales productivity measures revenue output relative to effort or time, like revenue per rep. Sales efficiency measures revenue relative to cost, like customer acquisition cost. Productivity asks whether reps do the right things. Efficiency asks whether revenue comes cost-effectively.
How does compensation visibility improve sales productivity?
Compensation visibility helps reps understand which actions affect quota attainment and earnings. When productivity analytics connects to incentive data, reps prioritize higher-impact activities. Managers coach with more context, and organizations design plans that reinforce revenue-driving behavior.
How often should sales productivity metrics be reviewed?
Review leading indicators like lead response time weekly. Review outcome metrics like win rate and pipeline velocity monthly. Review quota attainment and KPI definitions quarterly. A regular cadence keeps teams aligned and lets leaders course-correct before issues hit revenue.
What should you look for in a sales productivity analytics dashboard?
Look for real-time data and customizable KPI tracking. CRM integration, rep-level visibility, and forecasting matter too, along with compensation connectivity. The strongest dashboards surface insights inside the tools reps already use. They link productivity to quota progress and earnings.
How does AI improve sales productivity analytics?
AI improves sales productivity analytics through interaction scoring and next-best-action recommendations. It adds forecasting risk detection, automated activity capture, and anomaly alerts. AI helps teams move from reporting on the past to anticipating outcomes. Clean, contextual data keeps it reliable.