
For the RevOps team at
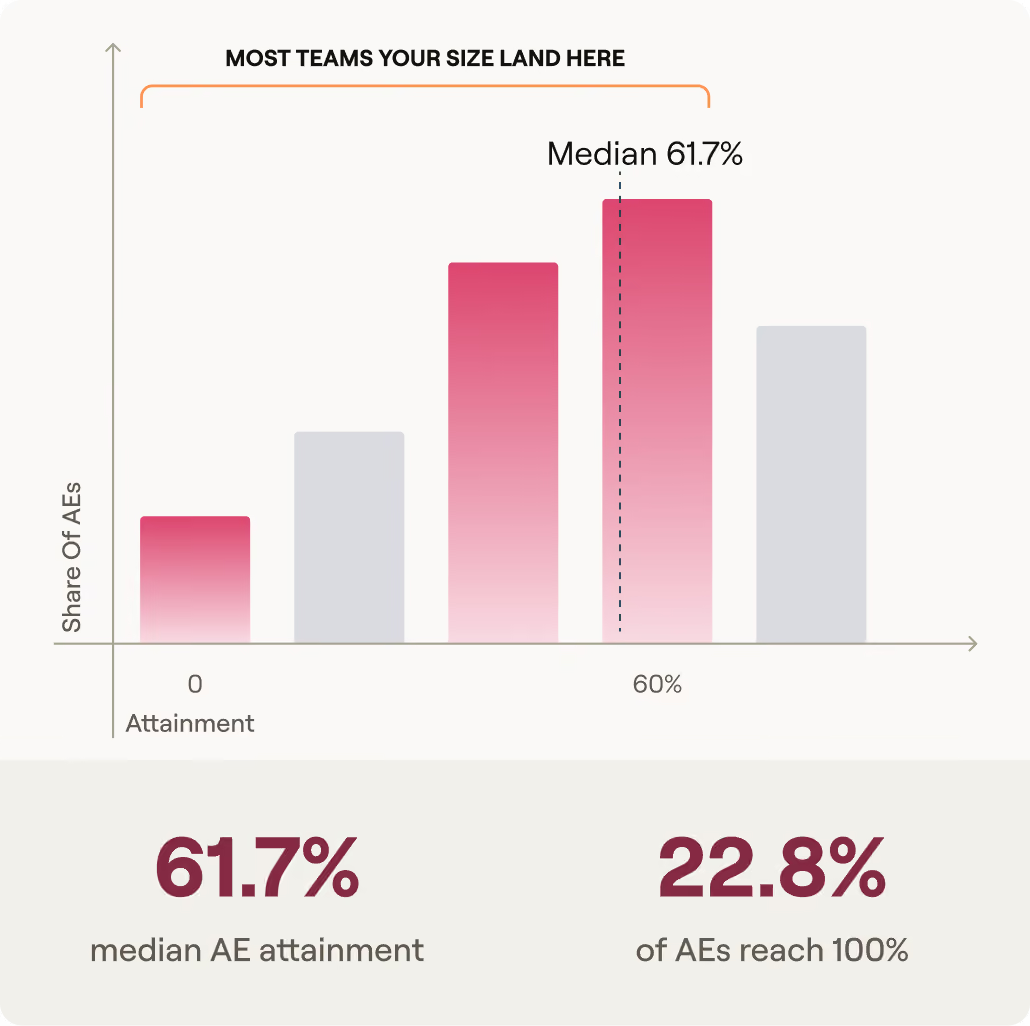
Fewer than 1 in 4 AEs hit quota

WHAT THIS MEANS FOR YOU
Across 25,000+ quota records, median attainment sits at 61.7% and only 22.8% of AEs reach 100%. Whether you run a team of twelve or twelve hundred, that curve holds, and most of your commission spend rides on the reps below the line. Your Distribution Health Score shows where your team actually falls on it, and how far the bottom tail runs.
WHAT YOU'LL GET
A read on your attainment vs. what the market says
Before you build the 2027 plan, see where attainment actually landed this year, and what that says about the quotas you're about to set.
01
Your Distribution Health Score
A 0–100 read on the shape of your attainment curve: in-band coverage, tightness, centering, and tail health.
02
Attainment by role and quota type
Benchmarked against companies running a similar number of quota carriers. A 40-rep team and a 400-rep team aren't the same market, so we size-match before we compare.
03
Quota levels and variable pay
In nominal terms and on a purchasing-power basis for every country you pay in.
04
The three plan-design choices
Most likely to cost you attainment next year, with what the data says about each.
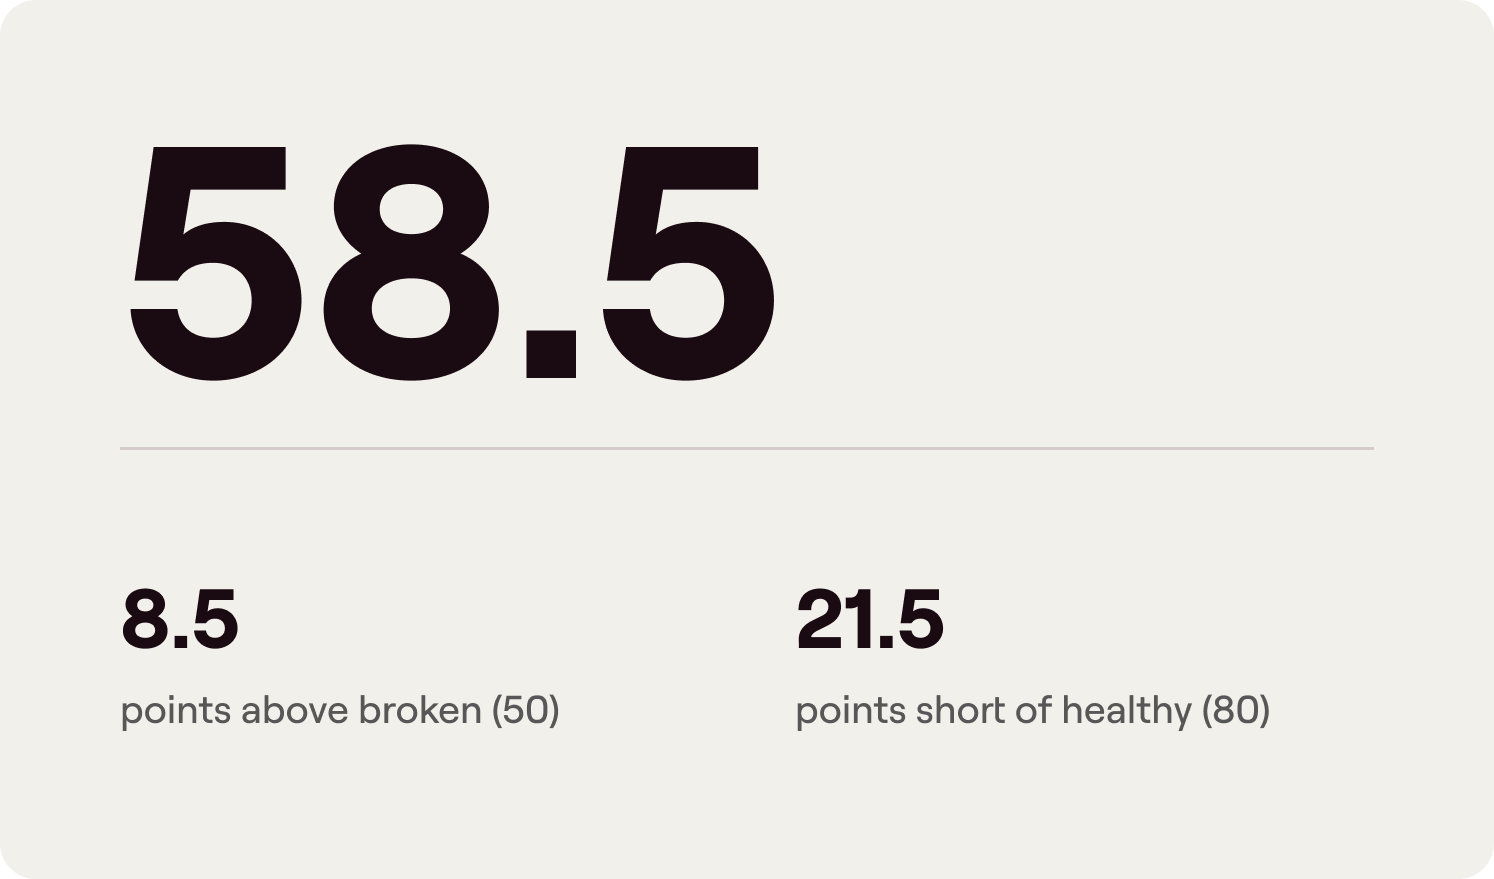
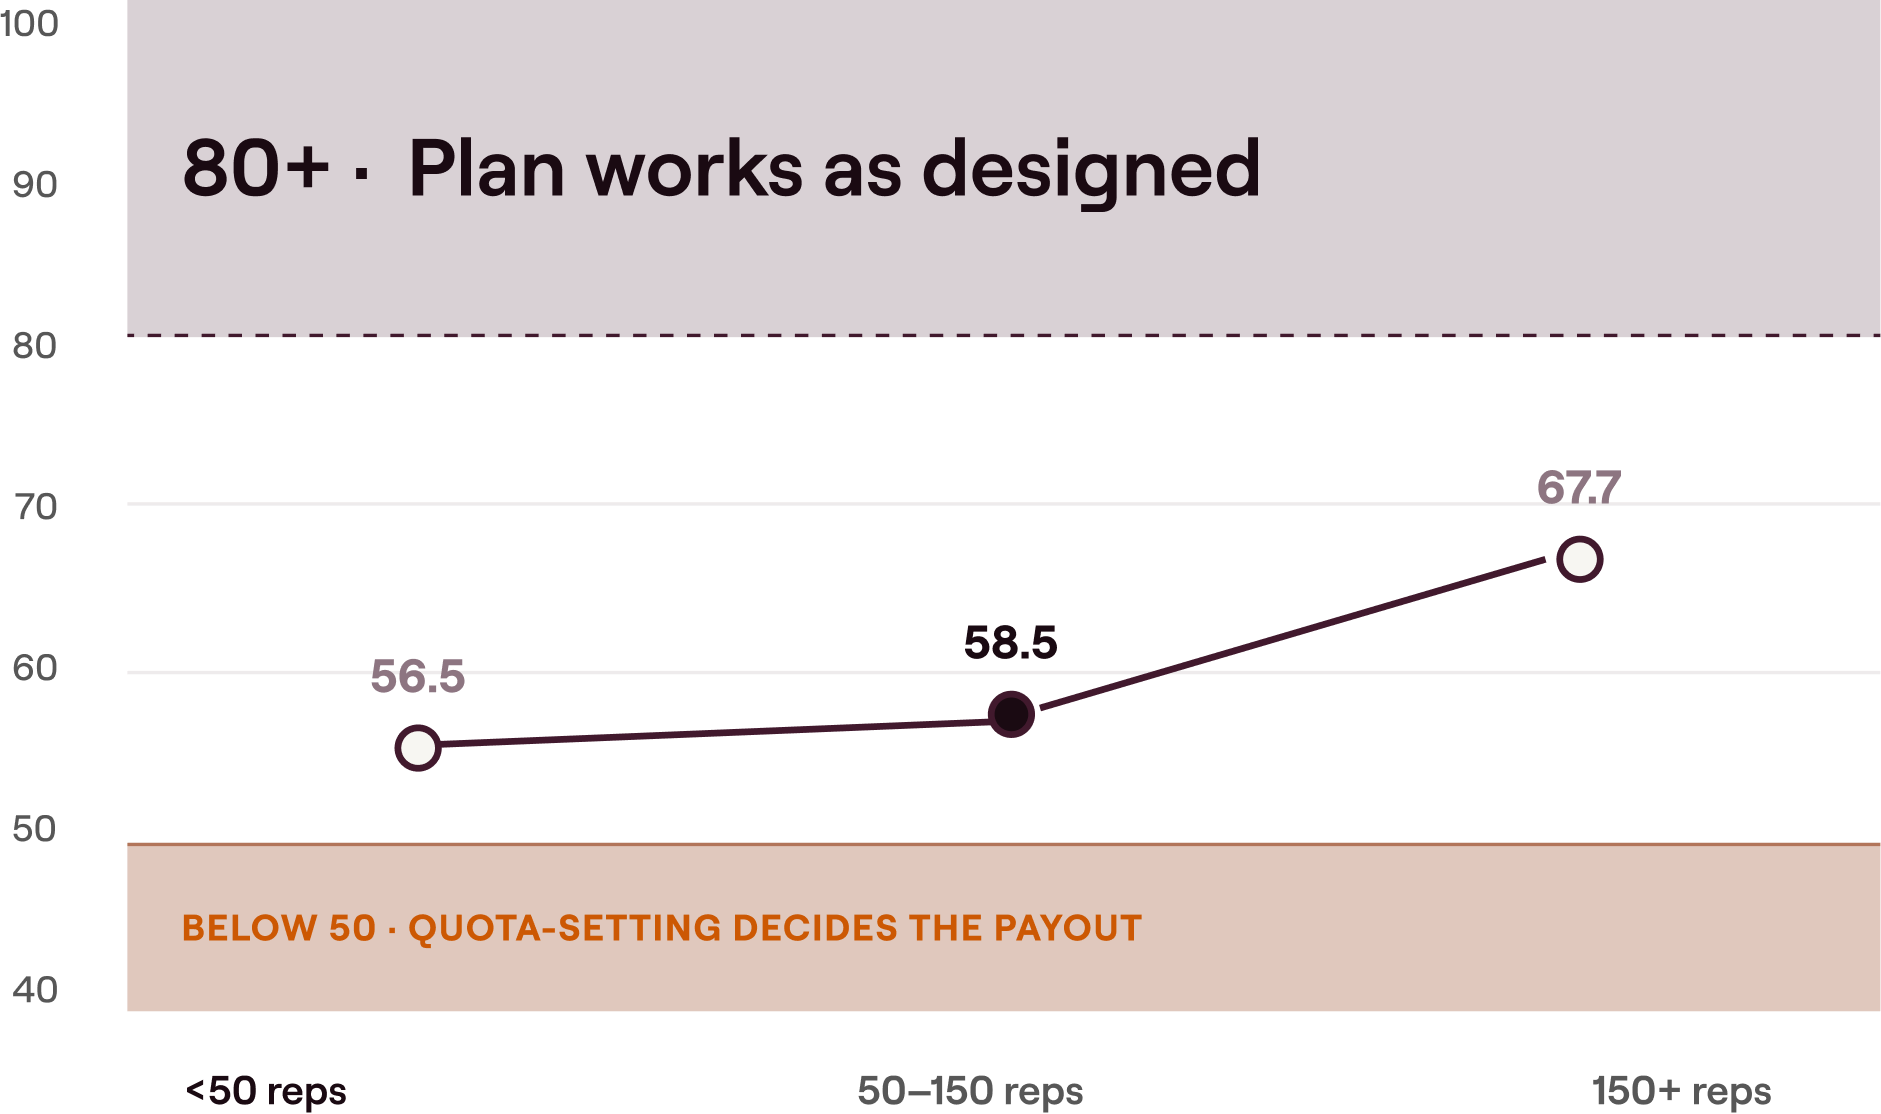
Companies at your size sit closer to broken than to healthy
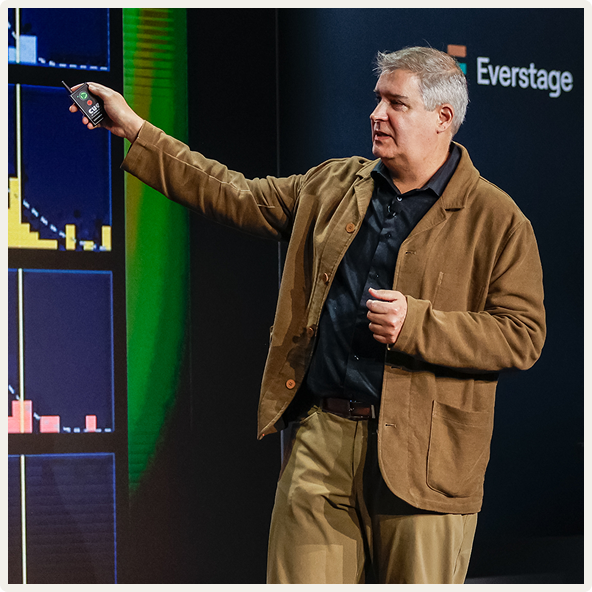
Jose Aleman built out this benchmark.
He's spent 15 years in sales ops, customer success, and product ops at Diligent, Galvanize, and ACL, and pulled apart the commission plans of 1,200+ go-to-market teams, costing the gaps and helping rebuild them. That work shaped the methodology behind every number here, so he usually knows what your curve will say before he reads it. He ran the Northstar'26 benchmarking session with RepVue's Ryan Walsh, to a room that wanted more time than the agenda gave.
Jose Aleman, VP, Revenue Architect, Everstage
What previous attendees have to say
“The 45 minutes with Jose did more for our planning than the consulting engagement we paid for the year before.”
[VP RevOps, Series C SaaS]
“We’d been guessing at our attainment spread. Seeing it size-matched changed the quota conversation with our CRO.”
[Sales Ops Director, mid-market SaaS]
“It was the first comp benchmark our CFO actually read, because it wasn’t a survey.”
[RevOps Lead, enterprise SaaS]

HOW IT WORKS
ONLY 17 SLOTS LEFT
Answer 4 simple questions and we will get back to you with your Distribution Health Score.
Give us the shape of your plan, and get a 45-minute read with Jose Aleman and your report in five business days, plus early access to the full report.
A SNEAK PEEK INTO THE REPORT
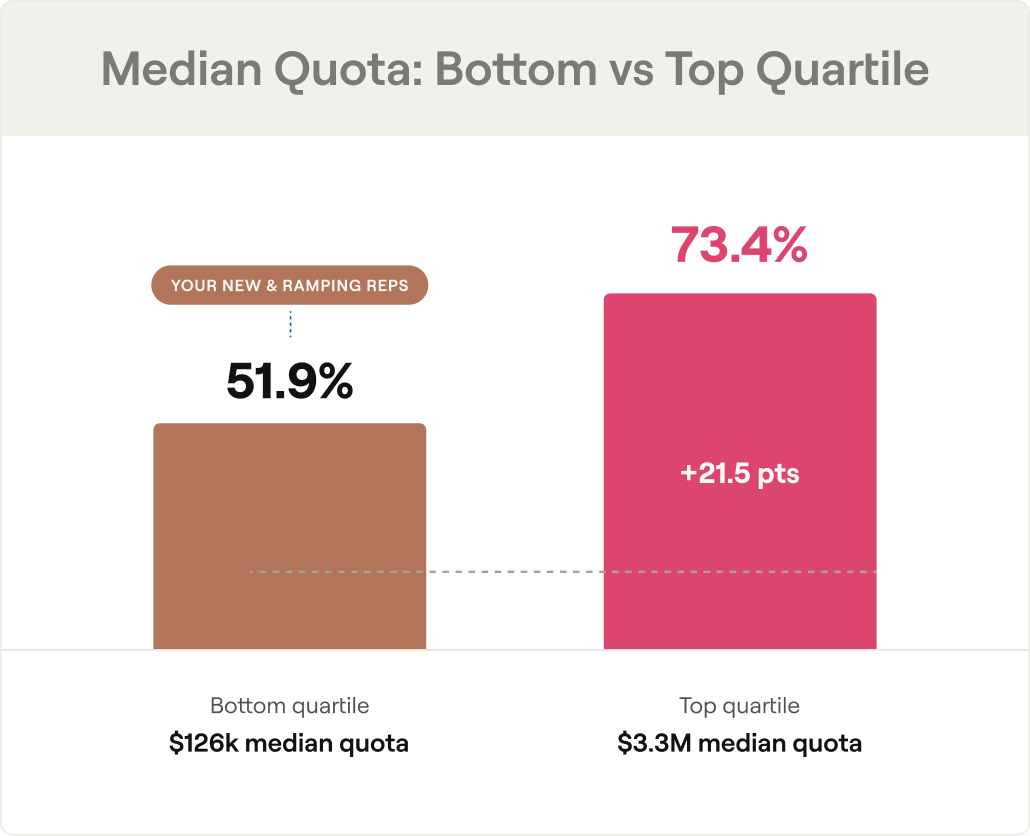
The largest quotas are the ones being hit.
We sort reps into four equal bands by quota size, and the pattern is clear: AEs with a median $3.3M quota attained 73.4%, while those at $126K attained just 51.9%.
In other words, the bigger the quota, the higher the attainment rate.
It’s not just a mix-of-reps effect either. Within the same company, the gap shows up in the same direction at 71% of firms large enough to test. That’s one finding. Your report has the version that applies to your book.

COMP TEAMS RUN ON THIS DATA






















Based on 2500+ customer reviews
METHODOLOGY
Where the numbers come from.
These benchmarks are computed from anonymized, aggregated records generated by commission plans running on Everstage across 200+ companies and 25,000 quota records.
- Any cohort of 25 or fewer people is suppressed. Every cut requires at least five distinct companies.
- Cells dominated by a single company are never published as market benchmarks.
- Customers who ask to be excluded are excluded.
Your 2027 planning cycle begins now.
Get a scored read on your own attainment curve before the plan is locked. Just takes a 2-minute survey & a 45-minute read on where you stand.

CONTINUE EXPLORING
Where to go from here.
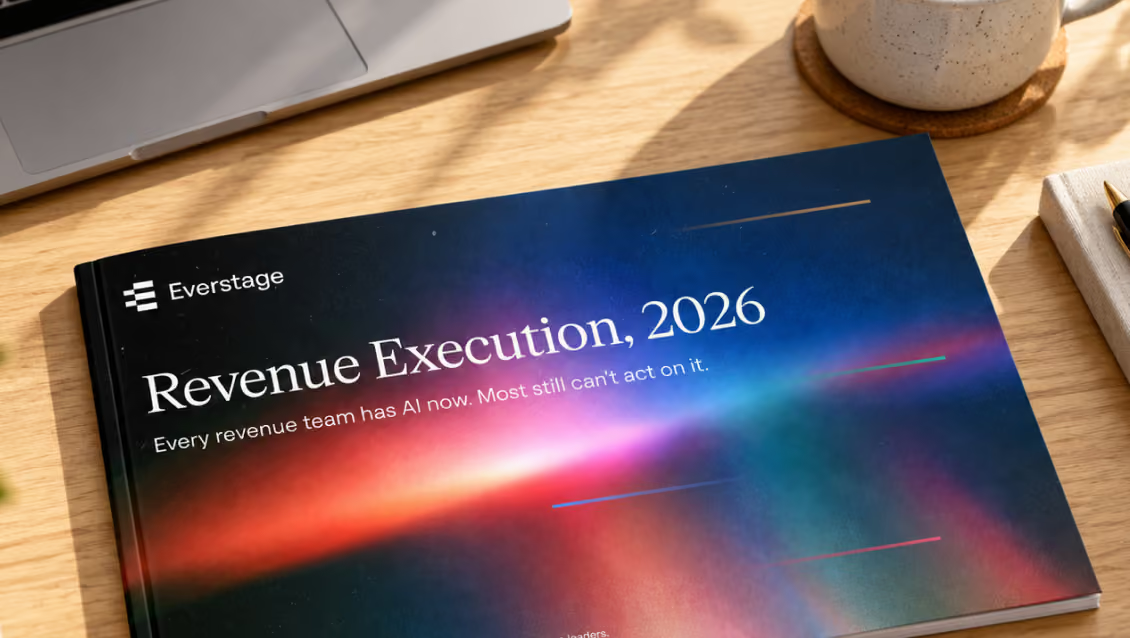
NEW RESEARCH
The Revenue Execution Survey
195 revenue teams, where RevOps and Sales describe the same system as two different companies. The report maps that gap, what it costs, and where execution breaks between the two.
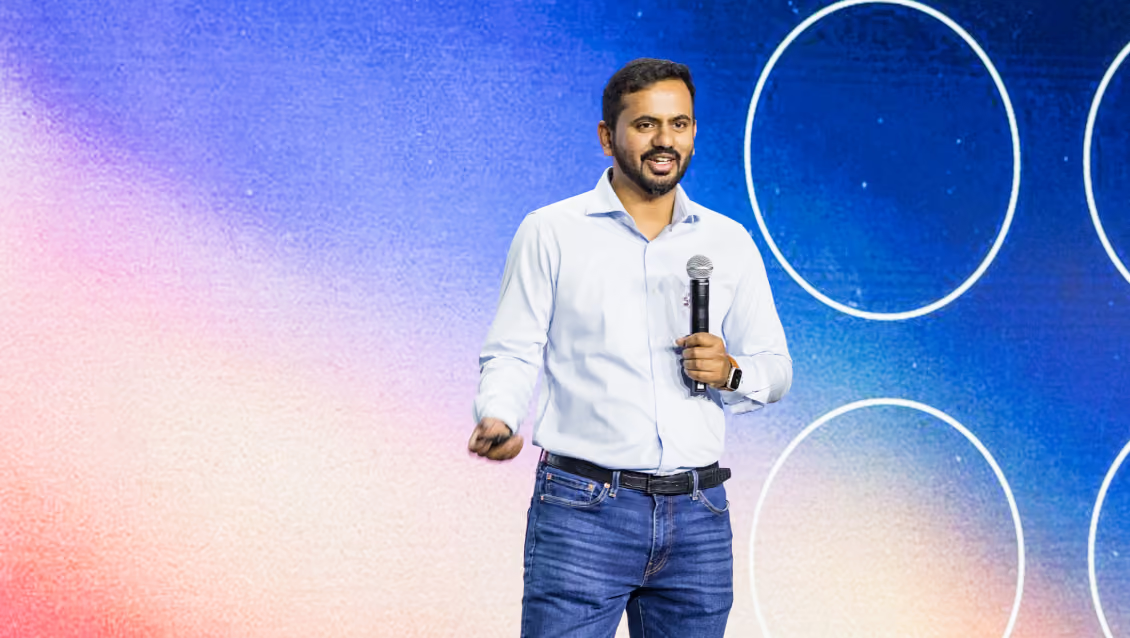
Watch Siva's Keynote at Northstar
You Are the System
In most revenue orgs, the system isn’t software. It’s usually a person. It’s probably you. Latest findings from 195 SaaS & AI revenue operators on what that actually costs: the lag between knowing and execution, when everything runs through one person’s week.