

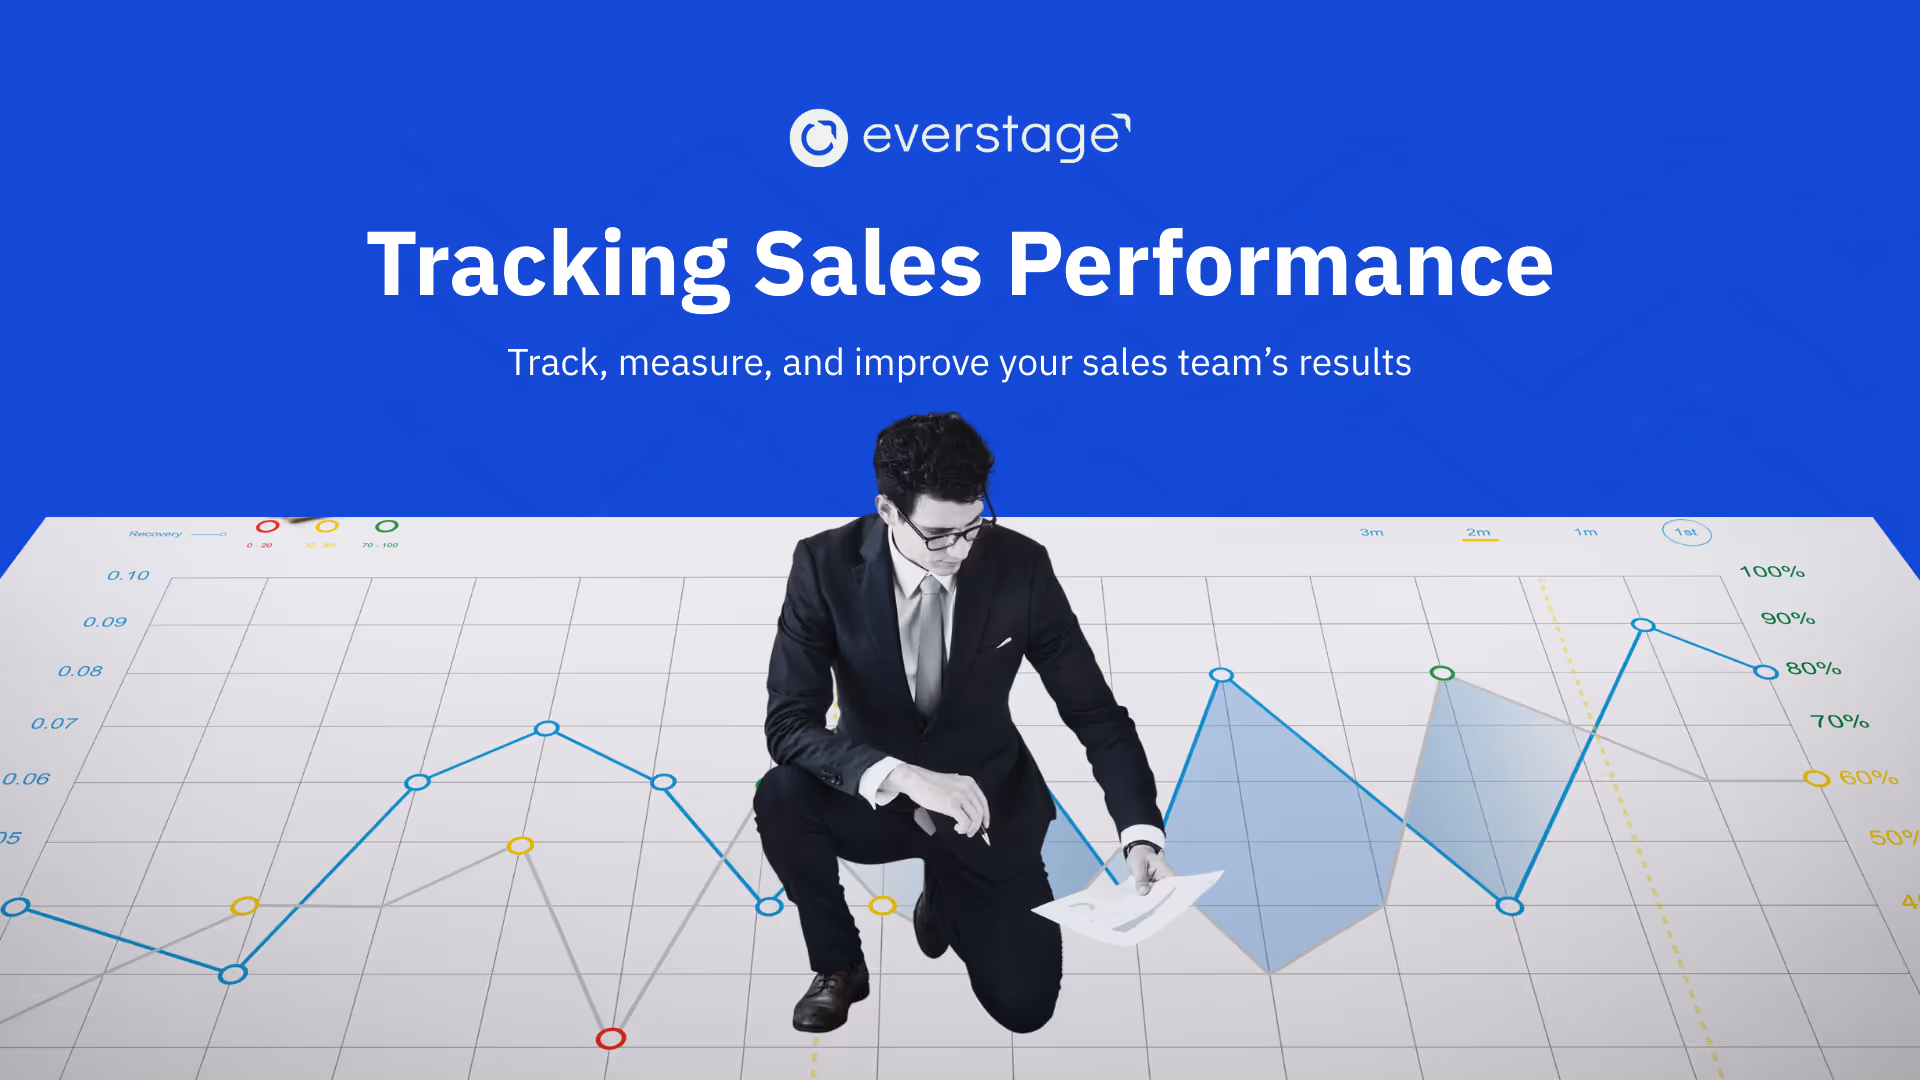
TL;DR
- Tracking sales performance means focusing on KPIs that reveal both short-term pipeline health and long-term revenue potential.
- Monitor a balanced mix of activity, conversion, revenue, and efficiency metrics for a complete view.
- Benchmark your numbers against industry standards to spot gaps and opportunities.
- Interpret metrics through both quantitative data and qualitative feedback for deeper insights.
- Turn findings into action with targeted coaching, process optimization, sales-marketing alignment, and sales enablement.
Introduction
You’ve probably been there. You open your sales dashboard and it’s packed with charts, graphs, and KPIs, but you still can’t figure out what’s actually moving deals forward or which salespeople are making the plays that truly move the needle.
It’s like trying to coach a sports team by staring at the scoreboard without watching the game. Sure, you see the score, but you have no idea which plays are working, which players are struggling, or where the real turning points are.
The issue isn’t a lack of data; it’s a lack of clarity.
Gartner found that 84% of sales leaders say analytics hasn’t boosted performance the way they expected. The biggest culprits? Bad data, privacy headaches, and teams not sharing what they know.
But when you fix the way you track sales performance, everything changes. When you zero in on the right metrics, track them with purpose, and connect them to specific actions, you stop guessing and start leading with confidence.
In this guide, you’ll learn exactly which KPIs deserve your attention, how to track them without drowning in reports, and how to interpret them so you can coach your team, adjust your strategy, and drive consistent revenue growth.
What Are the Core Sales Performance Metrics & KPIs

If you try to track everything, you end up learning nothing. Sales performance tracking works best when you focus on metrics that not only tell you what happened but also guide you toward what to do next. Here are some of the most impactful KPIs, why they matter, and how to measure them effectively.
1. Activity & Outreach Metrics
These are your earliest indicators of whether your sales engine is in motion. Think of them as the "pulse" of your sales team; the daily actions that eventually lead to pipeline growth. If these numbers are weak, your funnel will dry up before it even starts to flow.
Key metrics include:
- Number of cold calls/emails sent – A measure of outreach intensity.
- Meetings booked – Shows effectiveness in moving from interest to engagement.
- Demo scheduling rate – A direct indicator of product interest.
- Talk time per day – Reflects depth of engagement with prospects.
- Follow-up rate – Measures persistence; consistent follow-ups often decide whether a deal moves forward or stalls.
- Call-to-close ratio – Combines activity with outcome to reveal sales skill.
- Rep capacity – Number of active opportunities per rep or calls per day capacity.
How to track:
- Use your CRM (like Salesforce, HubSpot, or Zoho) to log all calls, emails, and meetings.
- Enable sales engagement platforms like Outreach, Apollo, or Salesloft to automate activity tracking and provide granular insights.
- Integrate call intelligence tools like Gong or Chorus for talk time and follow-up analysis.
- Create dashboards that show daily and weekly outreach volumes alongside conversion rates to identify drop-offs early.
2. Lead Generation & Funnel Entry Metrics
Volume alone isn’t enough. You need to ensure that the leads you bring in are the right ones. High volumes of unqualified leads clog your funnel, waste time, and frustrate both sales and marketing teams.
Core metrics:
- Marketing Qualified Leads (MQLs) – Leads that meet pre-defined marketing engagement criteria.
- Sales Qualified Leads (SQLs) – Leads vetted and accepted by sales as ready for direct engagement.
- Lead source attribution – Identifies which channels drive the best leads (e.g., LinkedIn Ads vs. webinars).
- Lead response time – The average time it takes for a rep to follow up with a new lead.
How to track:
- Configure CRM lead scoring rules so MQLs and SQLs are automatically categorized.
- Maintain accurate lead source data in CRM fields for attribution clarity.
- Use marketing automation tools like Marketo, HubSpot, or Pardot to track source performance.
- Implement alerts or task triggers for new leads so reps respond in minutes, not hours.
- Run periodic reviews with marketing to refine qualification criteria based on sales feedback.
3. Lead Conversion & Funnel Velocity Metrics
Once leads are in the funnel, the question becomes: how fast and efficiently are they moving toward a closed deal? Funnel velocity metrics show whether your process is smooth or if there are bottlenecks.
Key metrics:
- Conversion rate (Lead → Opportunity) – The percentage of leads turning into sales opportunities, giving you insight into the number of deals progressing through the funnel.
- Win rate – The percentage of opportunities that close successfully, often referred to as your close rate.
- Sales cycle length – The average time from initial contact to deal close.
- Deal slippage rate – This measures the percentage of deals that were expected to close in a given period but get pushed to the next. A high slippage rate is a red flag for poor forecasting accuracy and potential pipeline issues.
- Opportunities created vs. closed – Ensures new business development matches closing performance.
How to track:
- Set up pipeline stages clearly in your CRM so each opportunity is always in the right stage.
- Track the number of days opportunities spend in each stage to spot bottlenecks.
- Use CRM reporting tools or BI platforms like Tableau, Power BI, or Looker for visualizing stage-by-stage velocity.
- Review stalled deals weekly and assign action items to move them forward.
4. Revenue & Account Metrics
At the end of the day, sales is about driving measurable business growth. These metrics tie performance directly to revenue impact and customer value.
Essential metrics:
- Quota attainment – The percentage of sales reps hitting their targets.
- Revenue growth (YoY / QoQ) – Direct measure of business expansion.
- Average deal size – Influences revenue forecasting and sales strategies.
- Annual Contract Value (ACV) – Especially critical in SaaS and subscription models.
- Customer Lifetime Value (CLV) – Helps assess the ROI of acquisition efforts and spot opportunities for upsell or cross-selling to existing customers.
Pro insight: McKinsey emphasizes linking CLV with CAC to ensure you’re not overspending on acquisition relative to customer value.
How to track:
- Pull revenue and quota data directly from your CRM or ERP system.
- Maintain accurate pricing and contract details to calculate ACV.
- Integrate billing platforms (like Stripe, Recurly, or Chargebee) for real-time recurring revenue tracking.
- Calculate CLV using historical revenue and churn data stored in your CRM or analytics platform.
- Create dashboards that link CLV to acquisition cost to evaluate profitability.
5. Cost & Efficiency Metrics
Revenue shows you what you’re earning, but efficiency tells you whether it’s sustainable. You need to understand if the cost of generating sales aligns with the return.
Key metrics:
- Customer Acquisition Cost (CAC) – The Total cost of winning a new customer.
- CAC Payback Period – How long it takes to recover acquisition costs through revenue.
- Pipeline coverage ratio – Pipeline coverage ratio measures pipeline value vs. quota. While McKinsey suggests 3–4x, actual needs vary: longer enterprise cycles may require 4–5x, while faster SaaS sales may need 2–3x. Adjust coverage using sales cycle length, industry, and win rates.
- Forecast accuracy – How close your predictions are to actual results.
- Customer Retention Cost (CRC) – The cost of maintaining existing accounts to drive renewals and enable upsell opportunities. Useful for tracking account health and expansion efficiency rather than frontline sales performance.
How to track:
- Combine sales, marketing, and finance data to calculate CAC and CRC.
- Use CRM pipeline data for coverage ratios and pair it with revenue targets.
- Track forecast accuracy by comparing predicted vs. actual revenue at the end of each cycle.
- Leverage revenue intelligence tools like Clari or Anaplan to refine forecasting models.
- Monitor retention costs in your finance system, allocating expenses for account management, support, and engagement activities.
Beyond the numbers, keeping your reps motivated is what sustains strong performance over time. This guide unpacks the science behind that motivation.
Interpreting Metrics & Evaluating Performance
Collecting numbers is the easy part. The challenge and where real value comes in is knowing what those numbers actually mean. Here’s how you can interpret your metrics so they tell a story instead of just filling a spreadsheet.
Quantitative vs. Qualitative Evaluation
Your CRM can tell you what happened, but not always why it happened. That’s where qualitative insights come in.
Let’s say your win rate drops from 28% to 21% in a quarter. The raw number is a red flag, but without talking to reps or reviewing call recordings, you won’t know whether it’s because competitors are undercutting prices, your messaging has gone stale, or lead quality has slipped.
You should balance:
- Quantitative data – CRM reports, dashboards, and automated analytics.
- Qualitative feedback – Rep interviews, deal post-mortems, and customer feedback surveys.
By merging the two, you can identify whether a problem is strategic (like targeting the wrong industries) or tactical (like reps missing follow-up windows).
Balancing Activity Metrics and Outcome Metrics
It’s tempting to obsess over easy-to-track activity numbers, calls made, emails sent, and meetings booked. But if you measure only activity, you risk rewarding effort over results.
At the same time, focusing purely on outcomes like revenue and win rate ignores the early warning signs that activity metrics can provide. The best approach is to track both, so you can:
- Spot early dips in prospecting before they impact the pipeline.
- Link specific sales activities to positive results, so you can double down on what works.
- Identify over-activity with low results, a sign of misaligned targeting or ineffective messaging.
Data by itself doesn’t create clarity. Interpretation does. When you view your numbers through both a quantitative and qualitative lens and keep activity and outcome in balance, you get a true 360° picture of your sales performance. That’s what allows you to act with precision instead of guessing.
Improving Sales Performance Based on Insights
Tracking sales performance only matters if you use the insights to make changes that move the needle. Once you’ve spotted patterns in your metrics, the next step is to act on them with targeted improvements.
Coaching & Ongoing Training
If your data shows certain reps consistently struggling with conversion rates, it’s a signal for targeted coaching. Rather than running generic sales training, tailor sessions to individual gaps, whether it’s objection handling, negotiation skills, or product demos.
Tools like Gong or Chorus can help you pinpoint where conversations break down, so your coaching is based on real interactions, not guesswork.
Process Optimization & Lead Nurturing
Sometimes the issue isn’t skill, it’s process. If leads are stalling mid-sales funnel, look at your handoff between marketing and sales. Are MQLs being qualified correctly? Is your follow-up too slow?
Data can show you exactly where deals get stuck. Once identified, you can implement lead nurturing sequences, adjust follow-up cadences, or redesign sales pipeline stages to remove bottlenecks.
Sales & Marketing Alignment
Misalignment between sales and marketing is a classic performance killer. If your sales data shows a low conversion from MQL to SQL, it might be because both teams are working with different definitions of a “qualified lead.”
You can fix this by creating shared KPIs, joint reporting dashboards, and a feedback loop where sales tells marketing which leads converted and why.
Content Analytics & Sales Enablement
If your deals tend to stall late in the funnel, you may have a content gap. Look at your engagement data, are prospects opening proposals but not moving forward? Are they viewing case studies or ROI calculators?
By tracking which content actually moves deals forward, you can double down on the most effective assets and retire the ones that don’t perform. Pair this with sales enablement tools to make top-performing content easy for reps to find and share. Platforms like HubSpot Sales Hub can merge sales and marketing data to provide unified funnel overviews and pinpoint where leads drop throughout the buyer’s journey.
Why Tracking Sales Performance Matters
When you track sales performance effectively, you’re not just collecting numbers; you’re building clarity, confidence, and control over your revenue engine.
Without tracking, you’re left guessing where deals are going wrong, guessing if your team is spending time in the right places, and guessing whether you’ll hit the target this quarter. Effective sales performance tracking gives you:
- Clarity – You know exactly which actions drive results and which are wasted effort.
- Confidence – You can forecast with accuracy and back decisions with data instead of gut feel.
- Alignment – Sales, marketing, and leadership share the same definitions, sales goals, and performance picture.
- Growth – You spot opportunities and risks early, so you can double down on what works and fix what doesn’t.
Most importantly, tracking makes you proactive instead of reactive. It turns your sales process from a scramble into a system. And in a competitive market, that’s an advantage you can’t afford to skip.
Conclusion
Tracking sales performance turns numbers into actions, helping you hit sales targets faster and grow more predictably. When you focus on the right KPIs, monitor them consistently, and combine data with real-world context, your metrics stop being a static report and become a daily decision-making tool.
The real power lies in moving from reactive problem-solving to proactive growth. You’ll spot bottlenecks before they stall deals, double down on what works, and build a sales process that’s predictable, scalable, and sustainable, ensuring every deal not only closes but also lays the foundation for a lasting customer relationship.
Everstage makes sales performance tracking effortless, giving you real-time visibility into KPIs, pipeline health, and deal progress.
While compensation ensures fair rewards, performance tracking ensures consistent execution. With automated tracking and insights beyond spreadsheets, your data becomes a driver of daily decisions. Book a demo today to see the difference.
Book a demo today and see how your data can drive better decisions, every day.
Questions worth asking
The things most people want to know before they commit.
What’s the difference between sales performance tracking and sales forecasting?
Sales performance tracking measures what has already happened, like your actual activity, conversions, and total revenue outcomes, while sales forecasting predicts future results based on historical data, current pipeline, and market trends. Tracking informs forecasting by providing accurate, up-to-date performance data.
Can small businesses track sales performance without expensive tools?
Yes. Even small teams can use affordable or free tools like Google Sheets paired with CRM data exports, or entry-level CRM systems like HubSpot Free or Zoho CRM. The key is consistency, tracking a focused set of KPIs every week or month rather than trying to measure everything.
How often should sales performance be reviewed?
The review frequency depends on your sales cycle. Short-cycle teams might review metrics weekly, while long-cycle B2B teams often do monthly reviews. However, real-time monitoring of critical KPIs like quota attainment or pipeline coverage ensures you can act quickly if trends shift.
What role does customer feedback play in sales performance measurement?
Customer feedback adds a qualitative layer to performance tracking. While metrics show what happened, feedback reveals why, highlighting strengths to replicate and weaknesses to address in sales conversations, processes, or product positioning.
How do I know if my sales KPIs are realistic?
You can validate your KPIs by benchmarking them against industry averages from sources like McKinsey, Forrester, or CSO Insights. If your goals are far above or below these standards, adjust them to be challenging but achievable.
Can tracking sales performance improve team morale?
Absolutely. When reps see transparent, fair tracking that highlights both effort and results, it builds trust and accountability. Recognizing improvements in key metrics like conversion rate or follow-up speed can also boost motivation and create healthy competition.