- Average sales commission rates typically range from 5% to 20%, varying significantly by industry, deal size, and sales cycle length.
- SaaS companies generally offer 8%–12% commission on new bookings, while real estate agents earn 5%–6%, and insurance agents earn 5%–15%, depending on policy type.
- The right commission rate depends on factors like profit margins, product complexity, sales role, and your compensation structure (base plus commission, tiered, straight commission, etc.).
- Setting commission rates requires benchmarking against your industry, aligning with business goals, and balancing rep motivation with profitability.
- A dedicated FAQ section below covers the most common questions about commission rates, calculations, and industry-specific benchmarks.
What Are Sales Commission Rates?
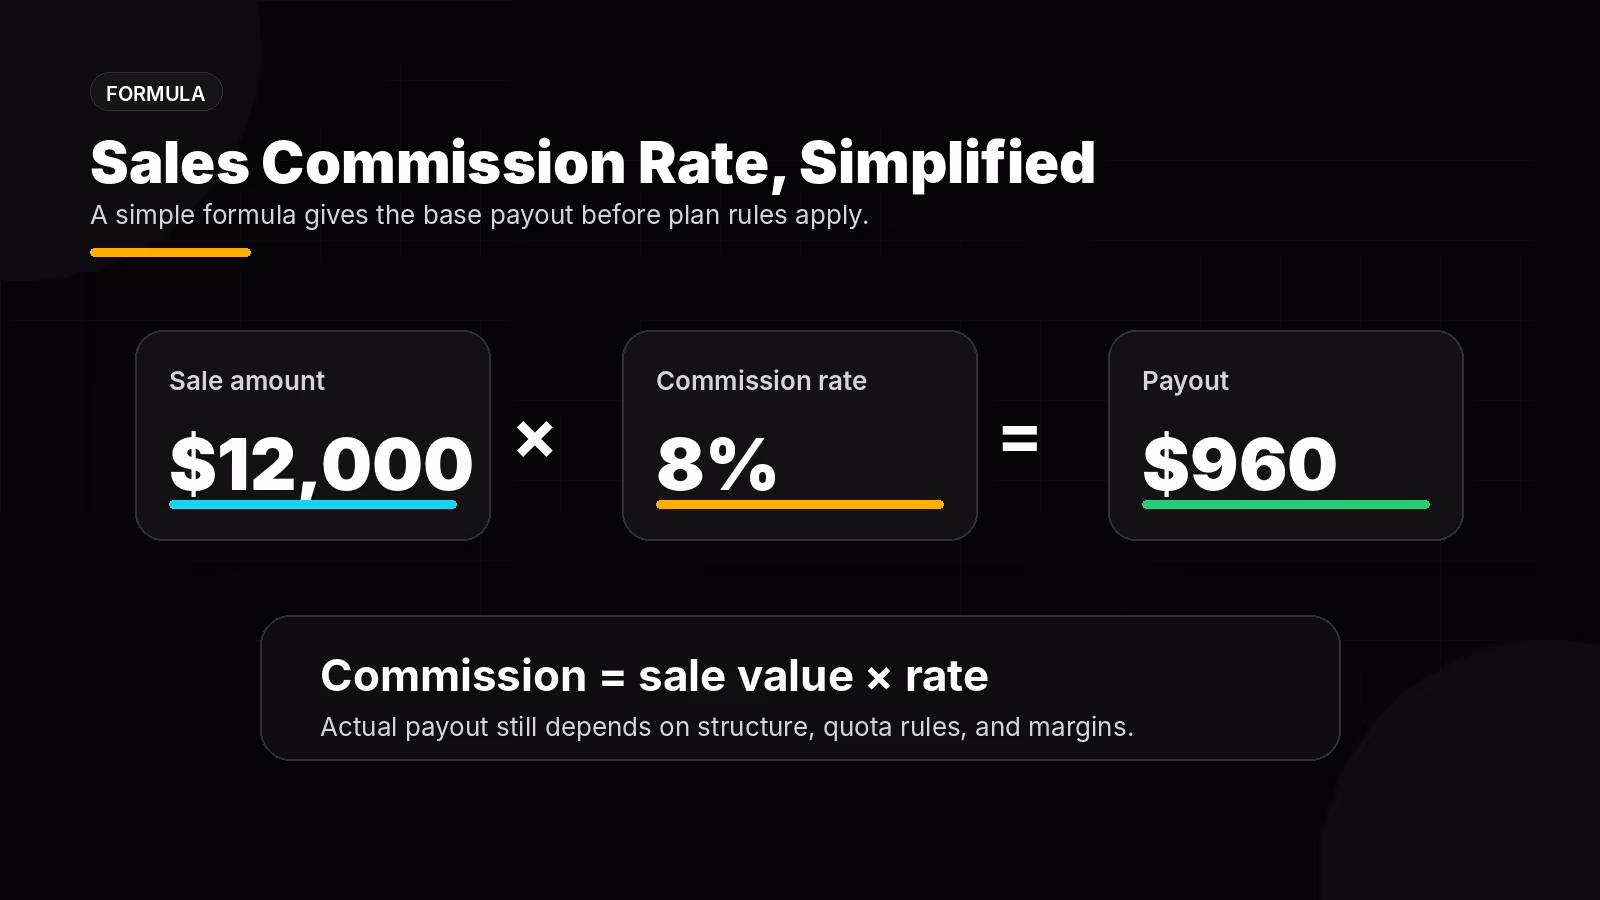
In simple terms, commission rates are the percentage of sales or a fixed amount that you pay your reps for the sales they make.
Here's an example. If the commission rate is 8%, and the total sale your rep made is $12,000, then:
Commission = 12,000 × (8/100) = $960
Hold on. If only commissions were that simple, without the spreadsheet headaches and late-night recalculations! The actual payout majorly depends on the sales commission structure you choose.
Before you finalize any rate, it helps to put clear payout terms in writing so reps know exactly what they'll earn.
Why Commission Rates Matter in 2026
Pay too little and reps will find a company offering more. Overpay without tying rates to the right metrics, and the margin math falls apart. Commission rates sit at the center of this tension. Adjusting them after rollout costs time, budget, and rep trust, and mid-year plan changes are one of the fastest ways to erode confidence in leadership.
Getting the rate right isn't a one-size-fits-all exercise. Your business goals, growth stage, product type, industry, and sales motion all shape what percentage makes sense. A structure working for a high-velocity SaaS team closing $15K annual contracts looks nothing like one motivating an enterprise healthcare rep managing a 9-month sales cycle.
Gartner's December 2024 research found sales organizations simplifying seller roles are 4.5x more likely to be top performers. Commission plan complexity is one of the most direct sources of seller role friction. When reps can't quickly calculate their own payout, the incentive stops functioning as intended.
Understanding commission rates is the foundation for building compensation plans your reps trust, and your finance team can defend. Everstage's State of Sales Compensation 2025 report covers how organizations across industries are structuring comp today, worth reviewing before setting your own benchmarks.
Understanding Sales Commission Structures
A rep's total pay is determined by on-target earnings, which include a fixed amount and variable pay. Sales commission structures determine how much of a rep's variable pay will be.
Commission structures not only define how reps get paid their variable incentive pay, but also give clarity on how many sales they have to make to achieve their financial goal.
In this way, reps would also know how fair and accurate their commissions are.
Below are the different types of sales commission structures:
- Base salary plus commission plan: Reps receive a fixed base salary plus a percentage of sales. Best for companies which want to offer income stability while still motivating performance.
- Straight commission plan: Reps earn 100% of their income from commissions with no base salary. Best for independent sales roles and organizations with high-margin products.
- Tiered commission plan: Commission rates increase as reps hit higher sales thresholds. Best for driving overperformance and rewarding top sellers.
- Territory volume commission plan: Commissions are based on total sales within a territory, split among the team. Best for collaborative sales environments.
- Gross margin commission plan: Reps earn a percentage of the profit margin rather than total revenue. Best for companies focused on profitability over volume.
- Base rate only: Reps receive a fixed salary with no variable component. Best for support or account management roles where retention matters more than new sales.
- Draws against commissions: Reps receive an advance on future commissions, which is deducted from earned commissions later. Best for onboarding new reps or seasonal businesses.
Get to know about these different commission structure types in detail, their pros and cons, and how to structure sales commissions.
Factors Influencing Sales Commission Rates
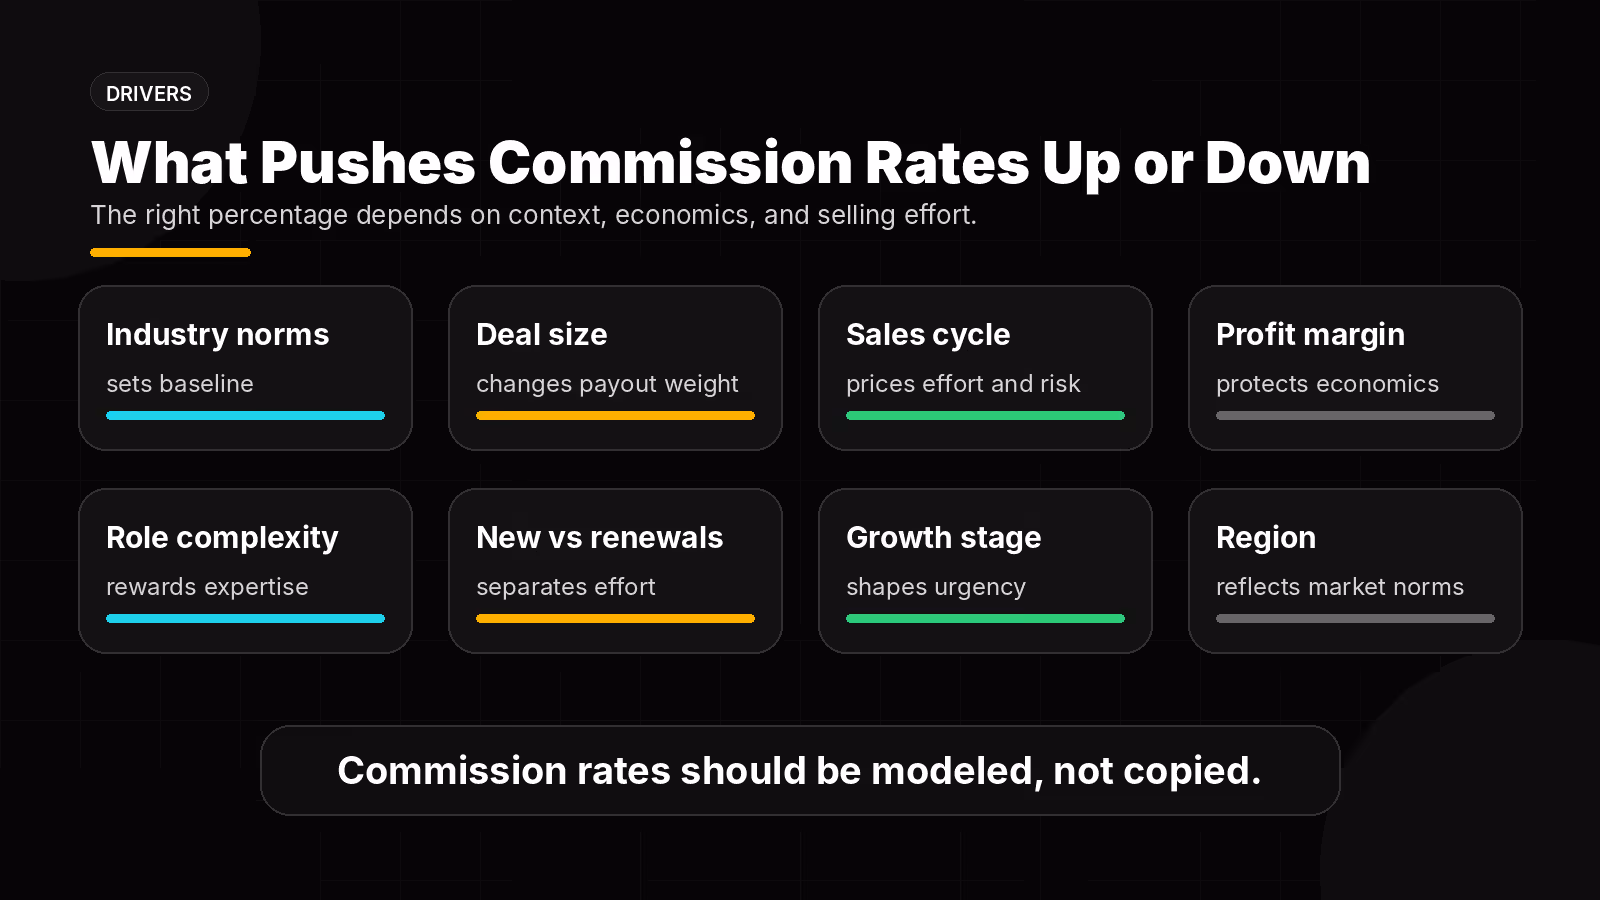
Commission rates don't exist in a vacuum. Several variables determine what percentage makes sense for your business. Here are the factors to consider:
- Industry: Commission norms vary widely. SaaS companies typically offer 8%–12%, while retail may offer 3%–10%. Your industry sets the baseline expectation.
- Deal size and average contract value: Higher-value deals often carry lower commission percentages because the absolute dollar payout is still significant. Smaller deal sizes may require higher rates to motivate reps.
- Sales cycle length: Longer, more complex sales cycles (common in enterprise B2B) often justify higher commission rates to compensate reps for the extended effort and uncertainty.
- Profit margins: Companies with thin margins cannot afford high commission rates. Gross margin commission structures help align rep incentives with profitability.
- Sales role complexity: Roles which require deep technical expertise, relationship management, or multi-stakeholder selling typically command higher commission rates than transactional sales roles.
- New business vs. renewals: New customer acquisition usually carries a higher commission rate (10%–15%) compared to renewals or upsells (5%–8%), reflecting the greater effort required.
- Company stage and growth goals: Early-stage companies may offer higher commissions to attract talent and drive aggressive growth, while mature organizations may optimize for profitability with lower rates and stronger base salaries.
- Geographic and regional differences: Commission expectations can vary by region due to cost of living, local market norms, and regulatory requirements.
How commission rate structures shifted from 2025 to 2026
The headline rates across most industries haven't changed dramatically year-over-year. The architecture of how rates are applied has.
In SaaS and subscription businesses, commission structures are increasingly split across three distinct tiers: a higher rate for new ARR, a lower rate for renewals, and a separate rate for expansion revenue. The single-rate-for-all-bookings model is giving way to structures reflecting where growth actually comes from.
Retention has become as commercially significant as new acquisition in most SaaS segments, and commission plans are catching up.
In retail, rates are moving slightly downward, from a 1%–5% historical range toward 1%–4%, driven by margin compression from e-commerce competition and tighter inventory economics.
The broader structural shift is away from commission plans built around first-signature revenue and toward plans built around full customer lifetime value. Early-stage, but its effects are already visible in how finance teams model payout costs and how RevOps leaders design quota structures.
As more revenue shifts to recurring models, how you recognize commission expense over the customer lifecycle becomes just as important as the rate itself.
Average Sales Commission Rates by Industry (2026 Benchmarks)
Industry benchmarks are the most concrete starting point for calibrating your own commission rates. The table below covers 12 industries, including typical rate ranges, common structures, and key notes on how rates are applied. .
There's no one method to determine the commission rates and structures, but analyzing commissions of your industry is always a good place to start.
Here's a detailed breakdown of average commission rates by industry:
Comparing average sales commission rates
Note: The commission rates can be based on either total sales or gross profit, depending on the industry. Rates shown are averages and can vary based on company size, geography, and specific role.
SaaS / Software commission benchmarks
SaaS companies typically pay 8%–12% commission on new ARR or bookings. Account Executives closing new business sit at the higher end; renewal or expansion reps earn 2%–5%.
Tiered structures with accelerators above 100% quota attainment are standard, with some companies offering 1.5x–2x multipliers for overperformance. The base-to-variable pay split is commonly 50:50 or 60:40.
In 2026, more SaaS companies are formalizing distinct rates for new ARR, renewals, and expansion revenue separately, as retention metrics take on greater weight in growth planning.
Real estate commission benchmarks
Real estate agents typically earn 5%–6% of the property sale price, split between buyer and seller agents. Each agent receives roughly 2.5%–3%. Agents working under a brokerage also split their share with the brokerage, often on a 60/40 or 70/30 basis.
Financial services commission benchmarks
Financial services commission rates range from 5% to 10%, depending on the product. Loan officers may earn 0.5%–1.5% of the loan amount, while investment and insurance product sales can command higher percentages.
Regulatory requirements heavily influence how commissions are structured in this sector.
Healthcare and medical devices commission benchmarks
Healthcare sales commission rates span one of the widest ranges: 5% to 20%. Capital equipment sales, including surgical robots and imaging systems, carry higher rates due to long sales cycles and the technical expertise required.
Consumable and pharmaceutical sales sit at the lower end. Many medical device companies use tiered structures with quarterly or annual accelerators.
Manufacturing commission benchmarks
Manufacturing commission rates typically fall between 5% and 10%, often calculated on gross profit rather than total revenue. Sales cycles are long and relationship-driven. Reps managing large accounts or distributors may earn lower percentages on higher volumes.
Teams managing commission calculations across multiple industries and structures, especially where gross margin vs. revenue rules differ by product line, often find spreadsheets are the first thing to fail. Everstage's incentive management platform handles multi-structure, multi-currency commission calculations with full audit trails, so finance teams don't have to rebuild the logic manually each cycle.
If you're weighing whether a dedicated tool is the right move, it helps to know what to look for before you commit.
How to Determine the Right Commission Rate for Your Business
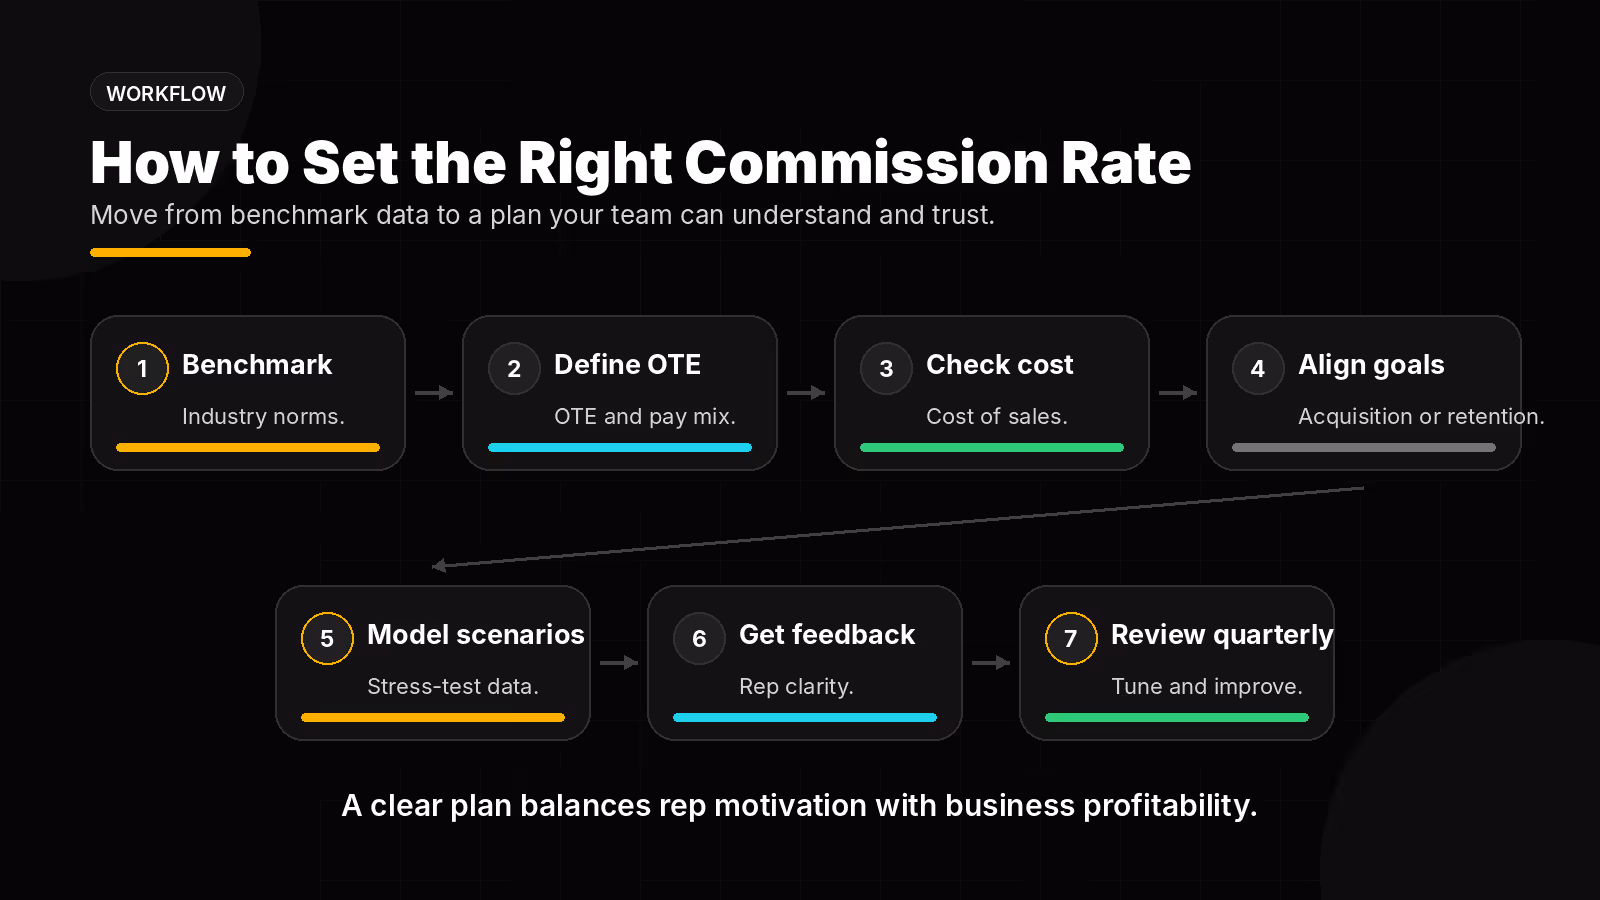
Knowing industry averages is a solid starting point, but the right commission rate for your organization depends on your specific context. Here's a step-by-step approach:
- Benchmark against your industry: Use the table above as a starting point. Identify where your business falls relative to industry norms based on your product type, deal size, and sales motion.
- Define your OTE and pay mix: Decide the total on-target earnings for each sales role, then determine the base-to-variable split. A 50:50 split is common in SaaS, while a 70:30 split may work better for longer sales cycles.
- Calculate your cost of sales: Ensure your commission rate keeps your cost of sales within a sustainable range. Most B2B companies target a cost of sales between 15% and 25% of revenue.
- Align with business goals: If you're prioritizing new customer acquisition, set higher rates for new business. If retention is the priority, weight commissions toward renewals and expansions.
- Model scenarios before rollout: Simulate how your proposed commission rates would have performed against last quarter's actual sales data. This prevents surprises and helps you stress-test the plan.
- Get rep feedback: Share the proposed plan with a small group of trusted reps. If they can't explain how they'd earn their target commission in under two minutes, the plan is too complex.
- Review and adjust quarterly: Commission rates aren't set-and-forget. Review attainment distribution, cost of sales, and rep feedback every quarter and fine-tune as needed.
💡 Pro Tip
When comparing commission rates, always consider your team's and total compensation mix—not just the percentage value. A 10% commission rate means very different things depending on whether the base salary is $50K or $100K.
Common Challenges for Sales Comp Leaders:
- Manual commission calculations that consume valuable time every payout cycle
- Audit risk and compliance headaches from spreadsheet-based tracking
- Difficulty scaling processes as your team grows across regions
- Limited visibility for reps and leadership into how commissions are calculated
- Disputes and shadow accounting eroding trust between sales and finance
Everstage automates commission calculations, ensures audit trails, and scales without the spreadsheet chaos. Book a demo to see how it works.
Build a Commission Rate Your Reps Will Chase, and Finance Can Approve
You need driven sales reps to bring in new customers and take your business forward. Setting the right sales commission structures is what attracts the right talent. Get started with the basics, be open to experimentation, and keep fine-tuning the structure based on the results you get.
With the right tools and mindset, you can build a growth engine your finance team can trust. The commission rates and structures outlined above give you a strong foundation, but the real advantage comes from pairing smart plan design with a system that automates calculations, gives reps real-time visibility, and keeps your finance team audit-ready.
If you're looking for a hand in tracking and managing sales commissions without any hassle, book a demo with us today!
Frequently Asked Questions
What industry has the highest sales commission rates?
Staffing and recruiting typically have the highest commission rates, ranging from 15% to 25% of the placement fee. Insurance also offers high first-year commissions, sometimes reaching 40%–100% of the first-year premium for life insurance products. In terms of the percentage of gross profit, automotive sales reps can earn 20%–25%. The "highest" rate depends on whether you're measuring the percentage of revenue, gross profit, or placement fee.
How do you calculate a 5% sales commission?
To calculate a 5% commission, multiply the total sale amount by 0.05. For example, if a rep closes a deal worth $50,000, the commission would be $50,000 × 0.05 = $2,500. If the commission is based on gross profit instead of revenue, you'd first calculate the gross profit on the deal and then apply the 5% rate to the figure.
What is a typical commission rate for SaaS sales?
SaaS sales commission rates typically range from 8% to 12% on new annual recurring revenue (ARR) or bookings. Renewal commissions are lower, usually 2%–5%. Most SaaS companies use a base-plus-commission structure with a 50:50 or 60:40 pay mix and include accelerators that increase the rate when reps exceed 100% of quota. Some high-growth SaaS companies offer rates up to 15% for strategic new business.
Do all sales jobs offer commission?
No, not all sales jobs include commission. Some roles, particularly in account management, customer success, or inside sales support, may use a base-rate-only compensation model. However, the majority of quota-carrying sales roles include a variable commission component. The trend in B2B sales is toward including variable pay for any role which directly influences revenue, including SDRs, BDRs, and even post-sales roles like Customer Success Managers.
How often should you review and adjust commission rates?
Most organizations review commission plans annually during their fiscal year planning cycle. However, quarterly check-ins on attainment distribution, cost of sales, and rep feedback are recommended. If more than 60%–70% of your reps are consistently missing quota, or if your cost of sales is trending above target, it may be time to adjust rates mid-year. Avoid making changes too frequently, as instability in commission plans erodes rep trust and motivation.
What is the difference between commission on revenue vs. gross profit?
Commission on revenue is calculated as a percentage of the total sale price, regardless of the cost to deliver the product or service. The commission on gross profit is calculated on the profit margin after subtracting direct costs. Gross profit commissions are common in manufacturing, automotive, and professional services, where margins vary significantly between deals. Revenue-based commissions are more common in SaaS and subscription businesses where margins are relatively consistent.


%20Quota-to-OTE%20Ratio_%402x-p-1080.avif)