Original Research · 2026
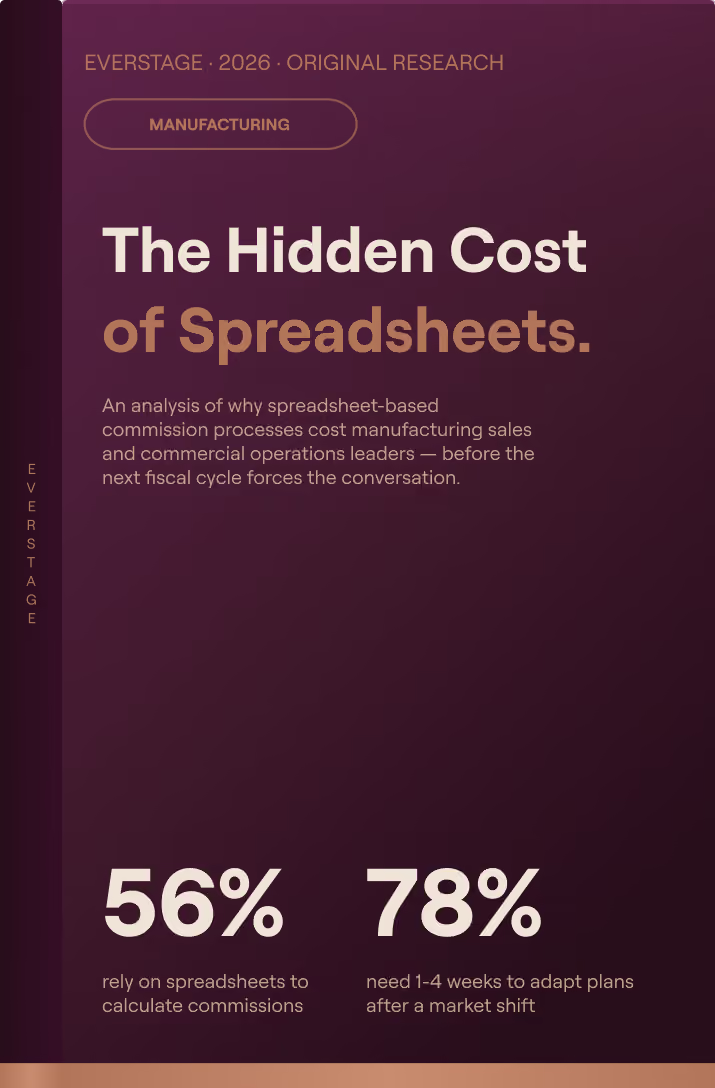
The commission process appears to work. That's the problem.
Based on 424 sales and commercial operations leaders surveyed by UserEvidence — the definitive study of spreadsheet-based commission processes among manufacturing organizations in 2026.
Research Partner
Everstage field manual
Sample
424 respondents · North America · 2026
X

Research Partner
Survey Respondents
424 Director+ sales & commercial ops leaders
Survey Period
Q1 2026 — Q2 2026
Company Profile
Manufacturing · North America

Jose Aleman
Vice President, GTM Excellence | Everstage
From the research team
We wanted to know why commission processes that produce correct payouts still cost organizations more than they realize.
Commission plans in manufacturing rarely live in a single system. Data gets pulled from SAP, Salesforce, warehouse platforms, and HR systems. One person stitches it together in Excel. The payouts go out. We kept hearing that the process works — but the people running it are burned out, plan changes get deferred, and nobody can explain the cost. We wanted to measure that gap.
The data confirmed what we suspected: 56% of manufacturing teams still rely on spreadsheets, and 78% need one to four weeks to adapt plans after a market shift. The process functions — but it breaks under change. And in manufacturing, change is constant.
What's inside
Five signs the process is costing you more than it produces.
Each pattern looks small on its own. Together, they describe a system that produces correct payouts at a cost the organization has stopped seeing.
01
Your best people, stuck in spreadsheets.
A small group spends a significant share of each cycle on commission calculations — relying on Excel and manual checks. As complexity grows across regions and products, the process does not scale. It concentrates.
What it costs
~25% of senior operator time — almost none of which appears in your commission budget.
02
The field runs its own math.
When reps don't trust the system, they build their own. District managers recreate calcs in Excel before statements arrive. Channel teams track distributor performance in parallel. Regional leaders keep their own view.
What it costs
It shows up in the next deal. Reps who don't trust the statement price risk into how aggressively they pursue the business.
03
Everything lives in one person's head.
How formulas are structured, why exceptions exist, which overrides apply — the operating model lives in spreadsheets, workarounds, and institutional memory. Plan documents may exist; the actual system does not.
What it costs
A quarter of disrupted payouts the moment that person leaves — plus the hiring premium to inherit it.
04
Every payout becomes a debate.
Resolution takes 2 to 8 hours. At 10 to 20 disputes per quarter across regions and business units, the cumulative time approaches a full headcount nobody budgeted. Every unresolved dispute confirms what the field already suspects: the official number is not the source of truth.
What it costs
2–4 weeks of senior time per quarter resolving disputes — plus erosion of trust between finance, sales ops, and the field.
05
What scaled was the team, not the system.
The spreadsheet that worked at 40 reps in one region is still running at 200 reps across four. Same Excel file, same owner, same manual process — extended to support a much larger organization. 78% of teams take 1–4 weeks to adapt plans after a market shift; only 10% can respond within a week.
What it costs
Every plan change becomes a multi-week project — so the CCO stops asking for the changes the business actually needs.
The capacity question
If above 30%, your most expensive hire is doing your least strategic work.
What share of the week goes to calculation and reconciliation versus plan design, territory modeling, and performance analysis? The gap between intent and reality is where the hidden cost lives.
40%
of a senior commission owner's week is spent on calculation mechanics — not plan design, territory modeling, or quota strategy.
Methodology
How this research was done
An original Everstage analysis of commission operations in mid-to-large manufacturing organizations. We're showing our work.
Conducted by
Everstage × UserEvidence
Audience
424 Director+ sales & commercial ops leaders
Geography
United States & Canada
Survey period
Q1 2026 — Q2 2026
Who we spoke with
Director, Head, and VP level operators across sales operations, revenue operations, commercial systems, and finance systems — at manufacturing organizations spanning company sizes from 200 employees to 10,000+. Roles are responsible for commission plan design, calculation, dispute resolution, and reporting.
What we looked at
Commission cycle time, data dependencies (SAP, Salesforce, warehouses, HR), dispute volume and resolution time, plan-change lead time, and the share of senior-operator time spent on calculation mechanics versus strategy.
How is Everstage priced?
Self-reported survey data reflects respondent perception of cycle time, dispute volume, and plan-change lead time — it has not been independently verified against finance system logs. Findings are directional and focused on manufacturing organizations in the United States and United Kingdom.
Transparency note: All data is anonymized and aggregated. Where percentages are stated (56%, 62%, 78%, 40%), they come from the 424-respondent survey fielded by UserEvidence on behalf of Everstage.