Original research · 2026
The commission process appears to work. That's the problem.
Based on 400+ Ops and Sales Comp leaders studied by Everstage and UserEvidence - the definitive study of spreadsheet-based commission processes among top orgs in 2026.
Research Partner

400+ respondents · 2026
Research Partner
Survey Respondents
400+ RevOps & Comp leaders
Survey Period
Q1 2026 - Q2 2026
Company Profile
Software · North America

Jose Aleman
Vice President, GTM Excellence | Everstage
From the research team
We wanted to know why commission processes that produce correct payouts still cost organizations more than they realize.
I spend most of my week with Sales Ops and Finance leaders. Their stack is fully modern. The commission process is not. It's still Excel, still one or two senior people maintaining it by hand, still consuming their Fridays.
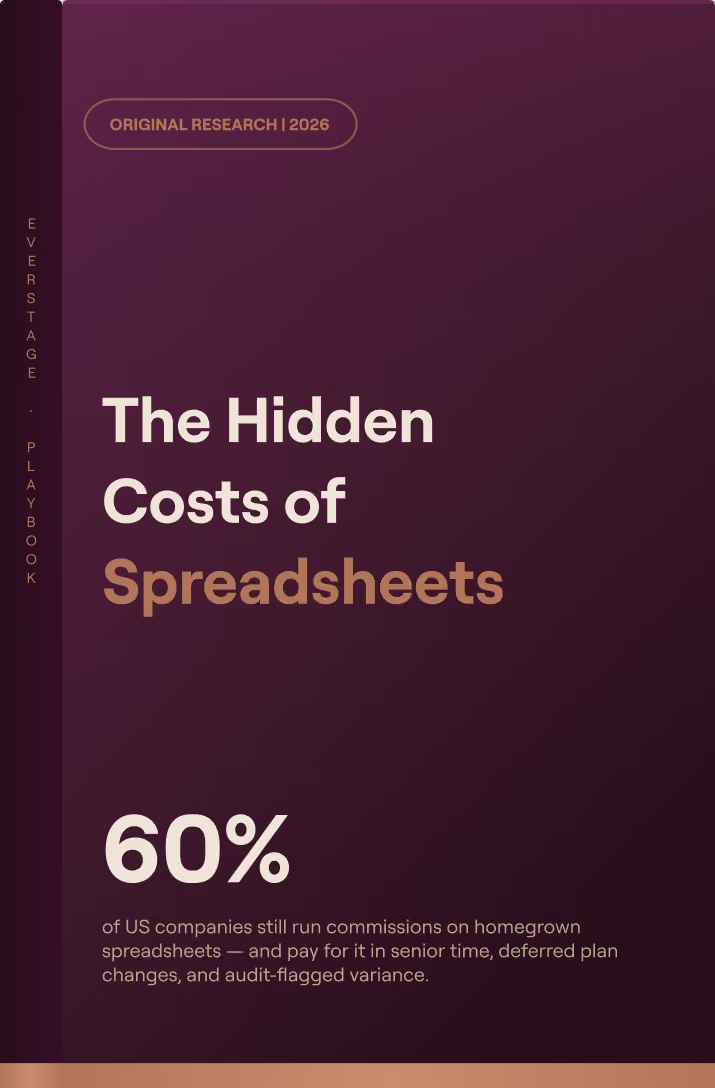
So we put numbers to it. The data confirmed what we suspected - 60% still run commissions on homegrown spreadsheets, with a much larger share quietly falling back to Excel for ASC 606, accruals, and disputes.
What surprised me wasn't that spreadsheets persist - it was the size of the tax. 25-40% of senior Ops and Finance time, every cycle. 4-6 weeks to ship a mid-cycle SPIF.
This report is the diagnostic. If even two of the five signs feel familiar, the cost has already started compounding.
What's inside
Five signs the spreadsheet has stopped paying for itself.
Each pattern looks small in isolation. Together, they describe a commission process that produces correct payouts at a cost the rest of the organization has stopped seeing.
01
25-40%
of senior Ops & Finance time consumed by the commission cycle
The senior-time tax
02
1 in 5
commission numbers in your org is the official one - the rest are shadow trackers
The shadow-spreadsheet economy
03
1-2
senior operators hold the entire compensation operating model
The one-person comp process
04
2-4 pts
of voluntary attrition on top performers tied directly to comp trust
The dispute compound effect
05
4-6 wks
to deploy a mid-cycle SPIF - missing the pipeline window leadership wanted
The plan-change cliff
Three takeaways
What the data actually says.
Five signs distill into three conclusions - each one explains why the next one matters.
Takeaway 01
The cost is real - it's just never priced.
Senior hours, top-seller attrition, ASC 606 variance, deferred plan changes. None of it reaches the budget. That's why the spreadsheet keeps running.
25-40% of senior time · 2-4 pts attrition
Takeaway 02
The maturity gap shows up before the dollar gap.
Pipeline, forecasting, engagement, analytics - all modernized. The last spreadsheet in your revenue stack is the one paying the reps.
9 of 10 RevOps functions · 1 still in Excel
Takeaway 03
The triggers happen on someone else's timeline.
Funding round. Audit. Acquisition. New CRO. The decision rarely comes from a review - it comes from a trigger. The variable you own is whether you're positioned before it hits.
7 triggers · Most outside your control
Methodology
How this research was done
An original Everstage analysis of commission operations in mid-to-large software organizations. We're showing our work.
Research partner
UserEvidence
Survey respondents
400+ RevOps & Sales Comp leaders
Geography
United States & United Kingdom
Survey period
Q1 2026 - Q2 2026
Who responded to this survey?
RevOps and Sales Compensation leaders at the Director, VP, and C-level - operating inside US/UK-headquartered B2B software companies between 200 and 2,000 FTE. Roles spanned Sales Operations, RevOps, Sales Compensation, Finance, and FP&A. Where commission processes were jointly owned, we surveyed the lead operator.
How were respondents recruited?
UserEvidence's verified research panel of operators, supplemented by direct outreach to senior Sales Comp and Ops leaders in the US/UK software ecosystem. Respondents were screened for current ownership of, or visibility into, the commission calculation process. No incentive was offered for specific answers.
What are the limitations of this data?
The sample skews toward growth-stage and mid-market B2B SaaS; results may differ for sub-200 FTE companies and non-software verticals. Attrition figures (2-4 points on top performers tied to comp trust) come from benchmarked samples within the panel, not a universal population.
Transparency note: Everstage is a sales compensation platform - we benefit if you decide your spreadsheet has stopped paying for itself. The data is honest about that conflict. The diagnostic in this report works whether or not you ever look at Everstage.